
Delhivery Ltd. is a mid-cap logistics services company (MCap of INR 31800 Cr as of 18th July, 2025) headquartered in Haryana. Delhivery Limited is India’s largest fully integrated logistics services provider.
Delhivery Ltd Company Summary
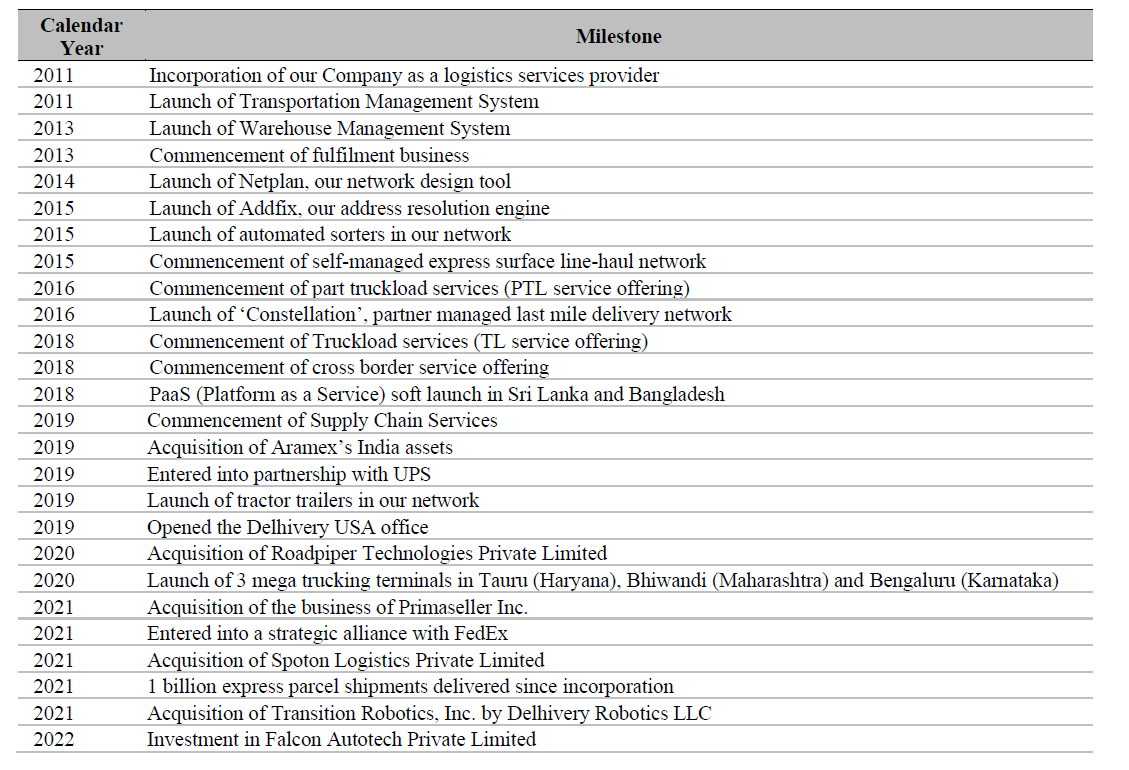
Founded in 2011 by Sahil Barua and co-founders, it was initially a hyperlocal delivery startup in Gurgaon but quickly pivoted to e-commerce logistics, signing its first online retail client by mid-2011. Over the past decade, Delhivery Ltd has built a nationwide network spanning 18,700+ pin codes and 24 automated sort centers, with 57,000+ personnel, enabling over 2 billion cumulative deliveries . Delhivery Ltd operates an asset-light, tech-driven model, investing in critical infrastructure (sorting hubs, technology) while leveraging a “managed marketplace” of partnered trucks, drivers, and small warehouses to flex capacity.
Delhivery Ltd. raised large rounds of funding from Softbank ($413 mn) and Fidelity ($ 277mn) in 2019 and 2021 respectively. These funds supported the expansion of its infrastructure and technology. Delhivery Ltd also pursued strategic acquisitions to broaden capabilities: the most important of them being the acquisition of Spoton Logistics in August 2021 for INR 1600 Cr. This instantly strengthened Delhivery Ltd’s presence in the part truck-load freight segment. Delhivery Ltd also bought a US-based drone startup, Transition Robotics, in 2021; Algorhythm Tech, a supply-chain software firm to enhance its fulfillment solutions; bought a stake in Vinculum in 2023, a SaaS platform for omni-channel retail management. Delhivery Ltd got listed in the stock exchanges in May 2022, raising ~INR 4000 Cr of fresh capital through the IPO.
Most recently, in 2025, Delhivery Ltd completed the acquisition of its express parcel delivery rival, Ecom Express, for a sum of INR 1369 Cr in what is considered to be a distress sale by the shareholders of Ecom Express. This should lead to significant consolidation in the e-commerce express parcels delivery industry with expectations of better pricing power for the industry as a result of the consolidation.
List of key company milestones from inception to 2022
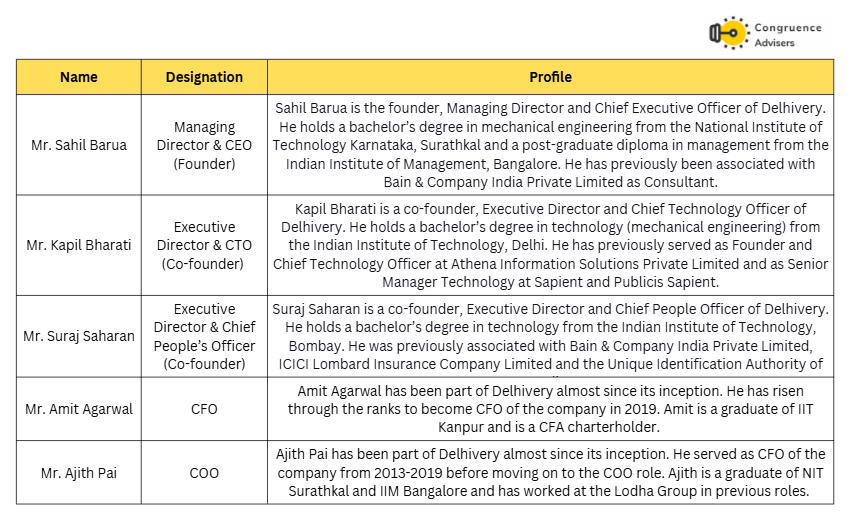
Delhivery Ltd Management Details
Sahil Barua co-founder and CEO of Delhivery Ltd has played a pivotal role in transforming Delhivery Ltd from a startup into one of India’s leading logistics and supply chain firms. Under his leadership Delhivery Ltd adopted a strong technology-first approach, enabling efficient, scalable and customer-centric logistics solutions. He has successfully expanded the business beyond e-commerce into multiple sectors and built a pan-India logistics network.
Delhivery Ltd. Industry Landscape
Size, structure and growth of the logistics Industry in India
The revenue from the logistics sector in India is estimated to reach USD 531 bn in 2026, growing at a CAGR of 6-7% per annum. The Logistics sector was estimated to employ ~2.2 Cr people in FY21 and is expected to add another 1 Cr jobs by 2027.
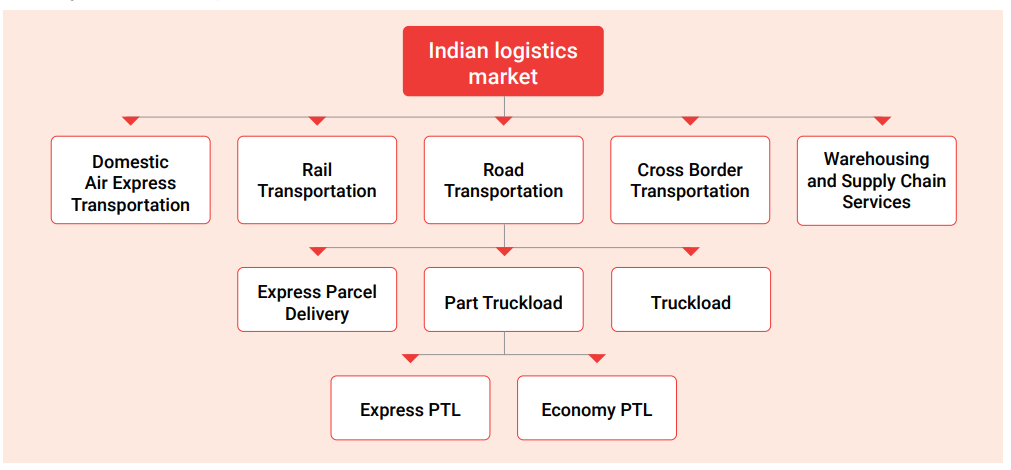
The logistics industry in India is split into air, rail, road, cross border & warehousing services. Road logistics is split into PTL, FTL and express parcel delivery services. Road is the dominant mode of transportation, carrying ~70% of freight volume in India, followed by railways at 18%. Air has < 1% share due to its high cost.
The logistics sector in India remains largely fragmented and unorganized. Most fleet owners in India own 2-3 trucks and most warehouses in India are standalone.
The biggest drivers for the Indian logistics sector are as follows
Continued growth of ecommerce – While growth rates have come off from the heady decade of the 2010s, e-commerce demand continues to grow steadily
Rise of quick commerce – The rise of quick commerce with Blinkit, Swiggy and D2C brands has led to a large increase in last mile delivery services
Increasing share of organized retail and FMCG distribution – As retail and FMCG become more and more organized, organized warehousing and storage space requirements go up.
Rising per capita income and middle class consumption – As India consumes more, more goods have to be delivered
Industrial growth and thrust on “Make in India” – Make in India has increased the volumes of industrial goods moved within and outside the country
Increased focus of Govt on infrastructure development – Govt’s focus on developing highways, railways and waterways is enabling far flung places to get connected at ever more economical costs, leading to higher movement of goods
The main drivers of cost and profitability in the logistics industry in India are as follows
1. Cost of fuel – Logistics costs in India are extremely sensitive to movement in global crude prices
2. Cost and availability of manpower – There is an increasing driver shortage for trucks in India due to demanding work conditions, leading to driver cost inflation and unavailability
3. Tolls and taxes – Toll charges and miscellaneous taxes comprise 10-15% share of the line haul costs in road transportation
4. Scale and network density – Logistics is a high fixed cost business which only becomes profitable after reaching a particular scale and throughput
5. Technology and automation – It is pretty much impossible to run efficient logistics operations in India today without using technology at every step such as route optimisation, network planning, pilferage detection, supply vs demand mapping etc.
6. Vehicle size and multi-modal transportation – Larger trucks can carry higher volumes leading to lower cost per KG of freight transported. Similarly, seamless inter-modal transport networks are lower cost than pure road transportation. E.g. Rail transport via dedicated freight corridor from Kolkata to Varanasi followed by road transport from Varanasi to Gorakhpur maybe cheaper than direct road transport from Kolkata to Gorakhpur
7. Competitive intensity and excess capacity – Excess capacity build up can lead to price undercutting leading to system level losses where every player becomes unprofitable and customers gain from the excess competition. A situation similar to this has been prevailing in the express parcel segment over the last few years, leading to consolidation.
Government Policies and objectives
The Government of India came up with the National Logistics Policy in 2022 with an aim to reduce logistics cost in India as % GDP from 13-14% to high single digits, to bring it more in line with that of developed countries. The Policy set an ambitious target to bring India among the top 25 ranks of the Logistics Performance Index (India’s current rank is 38) prepared by the World Bank. The PM Gati Shakti program for infrastructure development was a complimentary policy step which would help the country achieve the goals of the NLP.
Competitive landscape
The largest players in the express parcels segment are captive logistics arms of ecommerce companies such as Amazon Transportation Services, eKart, Valvo; new age 3PL logistics companies such as Delhivery Ltd, Xpressbees, Shadowfax and traditional logistics companies such as Blue Dart Express, TCI Express, DTDC, Gati etc. While the new age players have focused more on B2C parcels in the ecommerce and quick commerce spaces, traditional players like Blue Dart Express focus more on premium C2C and B2C parcels enabling higher margins but potentially at the cost of rapid growth.
The full truck load and part truck load market in India is dominated by companies such as TCI, Allcargo Logistics, VRL Logistics, Safexpress, CJI DARCL, Mahindra Logistics, Blackbuck etc.
Third party logistics and supply chain solutions is a space dominated by Mahindra Logistics, TVS Supply Chain Solutions, DHL Supply Chain India etc.
Historically, logistics has been an industry where simultaneous growth and profitability have eluded market participants. When there has been growth, it has come at the cost of profitability and when players have sought to increase profits, it has come at the cost of growth. These dynamics have meant that the logistics sector in India has not made money for investors in a significant way. However, considering the importance of the sector and the urgent need for India to reduce its logistics costs as % GDP, it is likely that one or more logistics companies will generate a lot of value in the future.
Delhivery Ltd Business Details
A few definitions will for metrics used by Delhivery Ltd in its financial reporting:
- Service Line wise EBITDA – This refers to segment wise EBITDA before loading corporate overheads
- Adjusted EBITDA – This is an adjusted metric wherein Delhivery Ltd. adjusts all non-recurring, non-operating and non-cash elements from EBITDA. While calculating adjusted EBITDA, Delhivery Ltd also subtracts the actual lease rentals paid during the year. Therefore, the adjusted EBITDA metric in a way is similar to the pre IND AS 116 definition of EBITDA where all lease rentals are subtracted to arrive at the EBITDA figure. However, additionally adjusted EBITDA also adjusts for non cash expenses like ESOP costs.
Geographical reach of Delhivery Ltd’s network
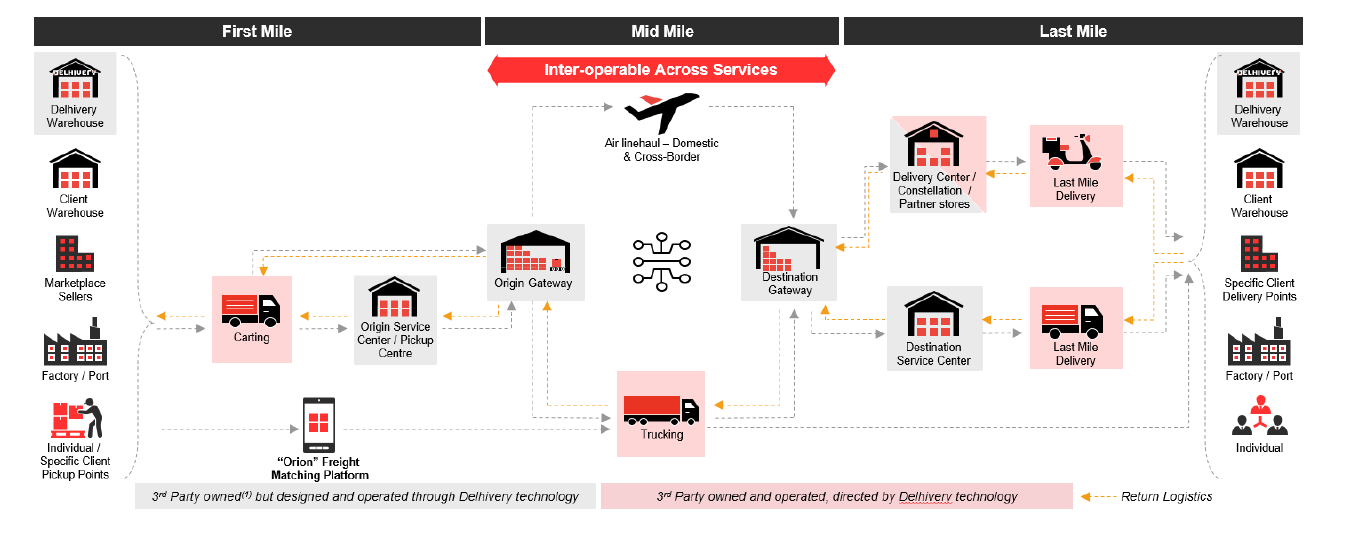
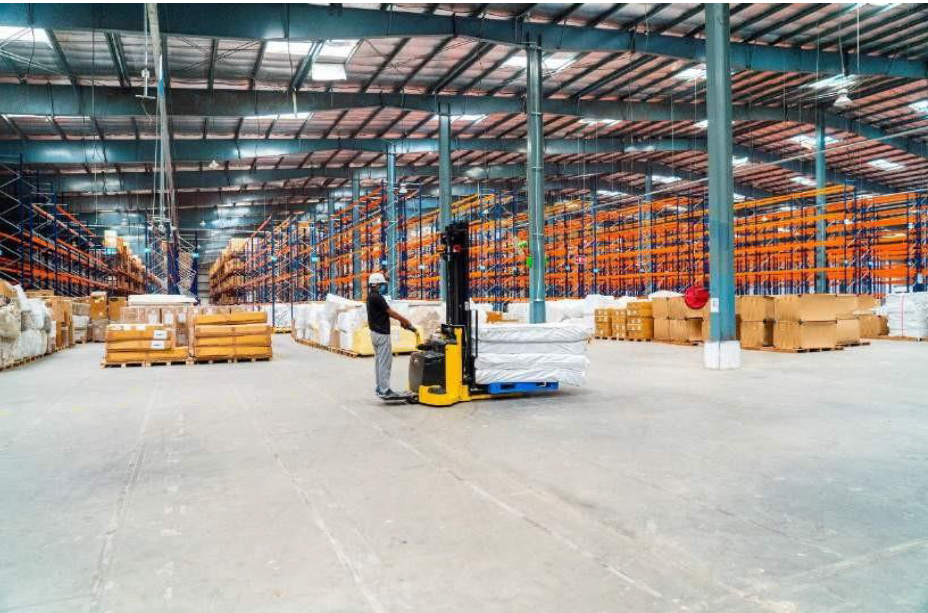
Delhivery Ltd’s operations are built on a vast, meticulously engineered network infrastructure that enables it to move shipments quickly and cost-effectively across India. The network can be visualized in layers: pickup, consolidation, line-haul, sorting, and last-mile delivery – all tied together by robust technology.
Delhivery Ltd’s network spans 18,833 pin codes across all 29 states and 8 union territories of India. Delhivery Ltd’s reach advantage means it can deliver to not just metros and Tier-2 cities, but deep rural areas and North-Eastern states, which many private couriers struggle with. It manages this via a combination of its own branch offices, franchisee partner centers, and delivery agents connected remotely.
Network architecture
The Delhivery Ltd network consists of 20 mn SFT of infrastructure spread across 111 gateways, 45 automated sort centers, 118 freight service centers, 3647 express delivery centers, 905 partner centers and a daily average fleet size of ~15000 vehicles. Delhivery Ltd employs ~62000 people either directly or on a contractual basis and works with an additional ~42000 partner agents.
Let’s understand components of this network better
1. Gateways and automated sort centers
Gateways are large logistics facilities that form the core of the Delhivery network. They perform pickup, sortation, consolidation and deconsolidation, dispatch and customs clearance operations. Gateways can simultaneously handle all product categories – express parcel, cross-border express and freight, heavy goods and PTL freight. All Delhivery gateways are connected to each other in a dynamic mesh network via line-haul transportation, unlike traditional hub-and-spoke models.
The gateways are equipped with 45 automated parcel sorters which have a rated capacity of more than 7mn parcels per day. These automated sorting systems provide throughput ranging from 3,000 to 32,000 shipments per hour.
2. Fulfilment centers
As of FY24, Delhivery Ltd operated 85 fulfilment centres with an aggregate floor area of 6.25 million SFT. Delhivery’s fulfilment centres are capable of multi-client, multi-channel operations, and of servicing B2C and B2B inventory management and order fulfilment requirements. Delhivery Ltd fulfilment centres are located in strategic supply and consumption clusters to enable customers to place inventory closer to their end consumers and reduce overall order fulfilment timelines. Several FCs are also co-located and operationally integrated with our gateways, further enhancing delivery speed and reducing overall fulfilment costs. Fulfilment centers are used for the supply chain services business line.
3. Service centers and delivery centers
Service centres and delivery centres perform last-mile delivery of consignments and pickup operations from their catchment areas. Parcels weighing less than 10kg are picked up and delivered by delivery centres while PTL loads and heavier parcels are picked up and delivered through service centres. As of FY25, Delhivery Ltd was operating 118 freight service centers and 3647 express delivery centers. Several of these delivery centers are operated by Delhivery Ltd’s Constellation franchise partners.
4. Fleet
Delhivery Ltd works with a daily average fleet size of 15000-16000 vehicles with a majority of these vehicles being leased from suppliers and very few vehicles being outright owned. Delhivery Ltd is focusing on increasing the penetration of 46-ft tractor trailers along the major line haul routes between high traffic destinations in order to increase economies of scale. As of FY24, Delhivery Ltd employed 753 46-ft tractor trailers in its fleet.
Technology
Delhivery Ltd prides itself on being a technology first logistics solutions company. Delhivery has developed over 80 internal applications to leverage the power of the data at its disposal to make operations smoother and more efficient. Delhivery Ltd employs a team of more than 500 people who look after engineering, data sciences and product development.
Delhivery Ltd’s technology architecture has 3 layers as depicted below
CoreOS: CoreOS provides reusable, business-agnostic tools and services that define standards and data governance frameworks for logistics. This layer provides foundational and security components and standardizes the exchange of data between services.
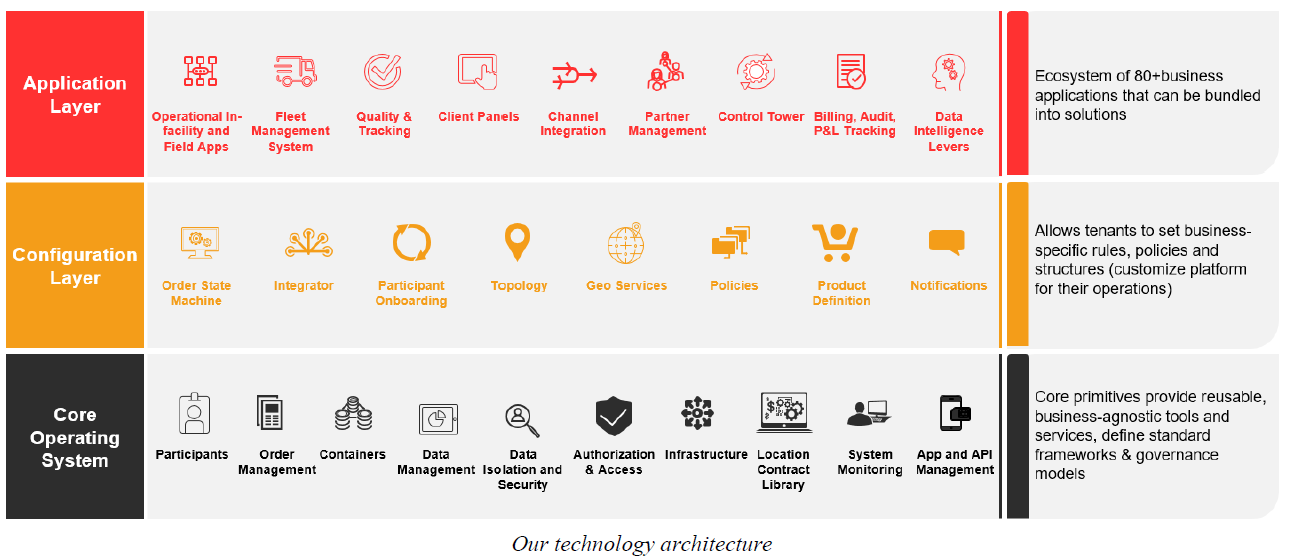
Configuration layer: This consists of dynamic frameworks that enable rules, policies and structures based on business specific, geography specific and customer specific requirements. It facilitates creation and configuration of custom rules and operational workflows that enable interoperability of the same underlying network assets and infrastructure across a variety of supply chain use cases.
Application layer: This layer consists of purpose-built business applications and services developed by our inhouse product, technology and data teams as well as third party developer partners. These applications and services are, in turn, bundled into solutions serving a variety of supply chain use cases.
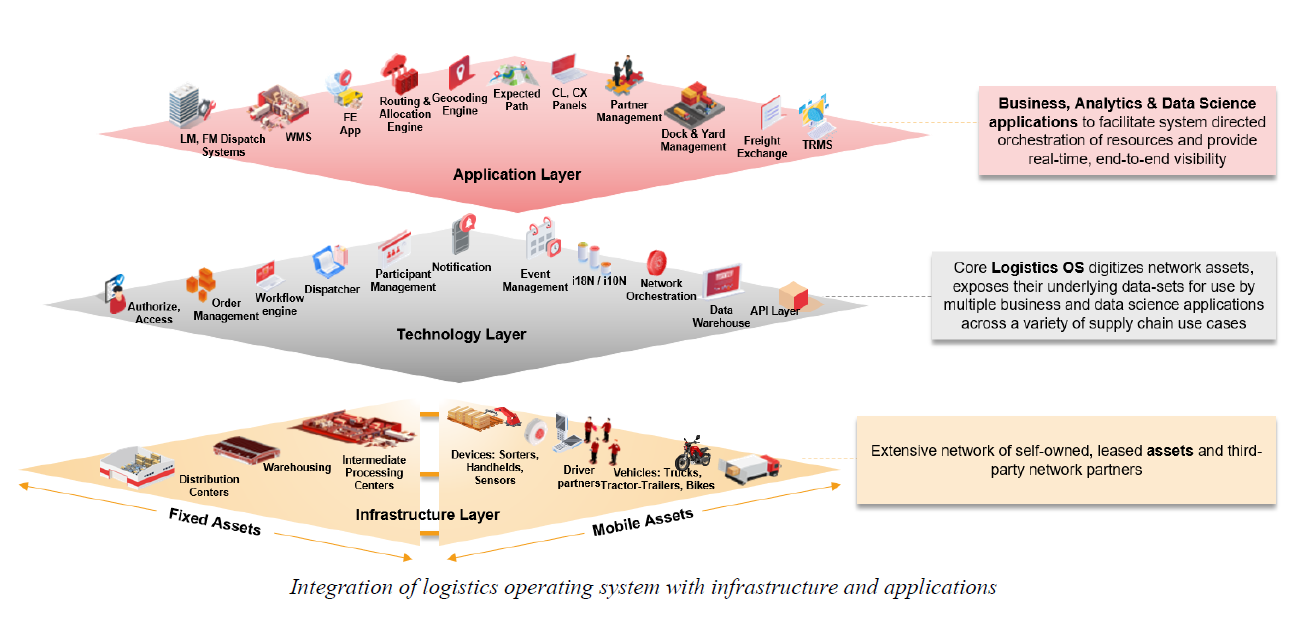
Another abstraction of Delhivery Ltd’s technology stack connecting infrastructure to end user applications (mostly internal users) via technology is depicted below
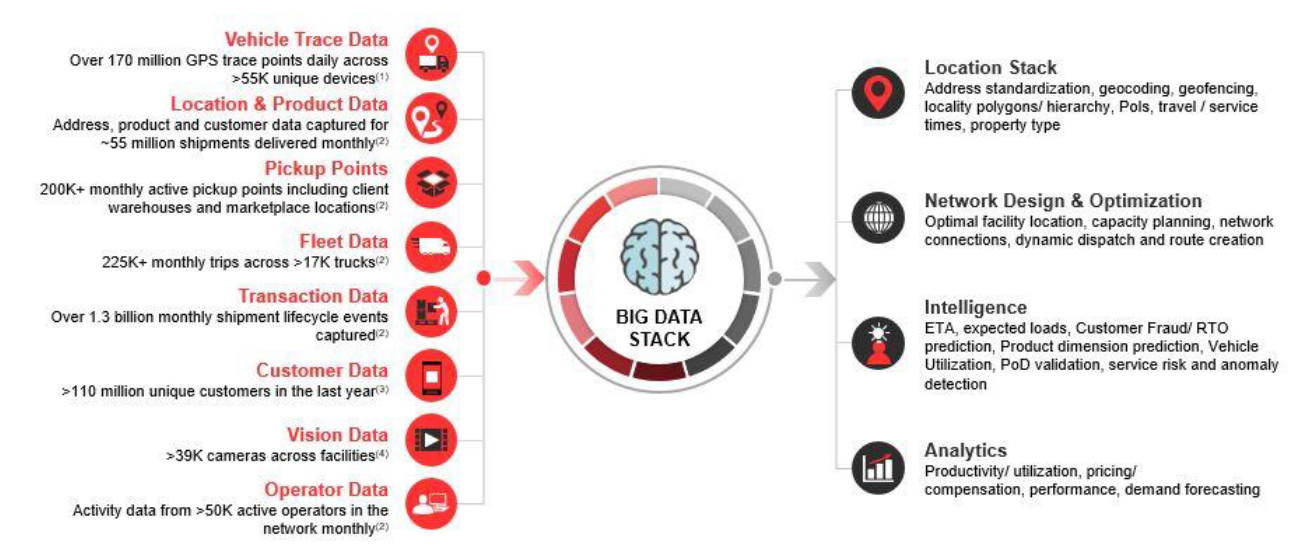
A schematic of Delhivery Ltd’s big data stack is depicted below
Delhivery Ltd’s service lines
Delhivery Ltd operates across 5 distinct service lines in logistics. All the service lines use the common network infrastructure but may have very different customer cohorts, service levels and business requirements.
1. Express Parcels – This segment deals with time limited quick deliveries (24-48h) of B2C and C2C parcels, mostly for parcels weighing less than 10 KGs. Delhivery Ltd also offers express parcel service for heavier loads under their heavy goods service. A large segment of parcels in this segment originate from e-commerce companies such as Amazon, Flipkart, Meesho, AJIO etc. A growing cohort in this segment are D2C companies such as Nykaa, MamaEarth etc.
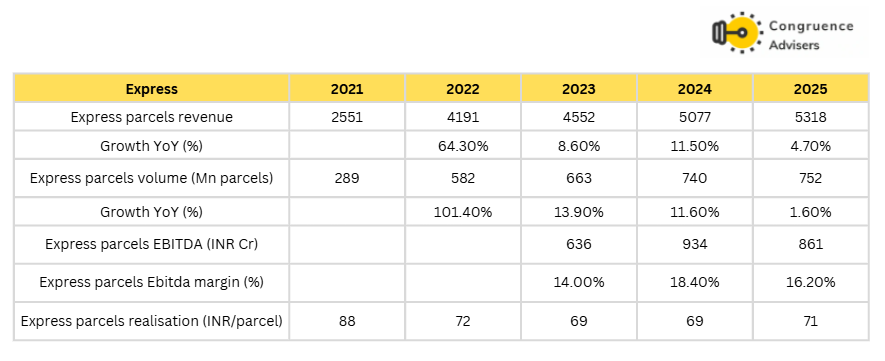
Over the years, the nature of the express parcels segment has changed. In the 2010s, Delhivery Ltd’s express parcels volumes were growing rapidly along with e-commerce volumes. At some point, leading e-commerce companies like Amazon and Flipkart decided to in-source their logistics business rather than outsourcing it to 3rd party players like Delhivery by setting up captive logistics companies such as eKart and ATS. Companies like Meesho have also aggressively started insourcing their volumes over the last year or so.
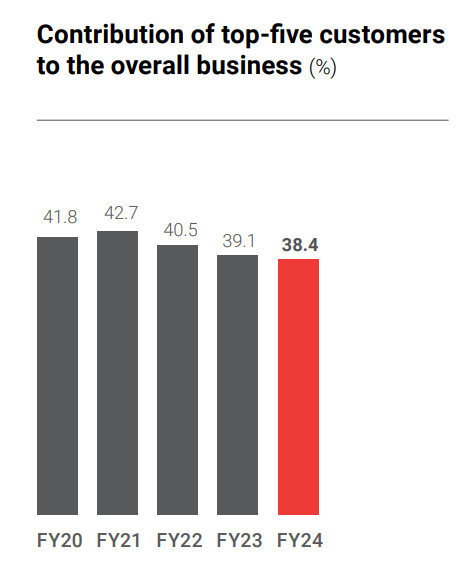
This has caused a slowdown in Delhivery Ltd’s express parcels segment YoY growth rates over FY24 and FY25. While the largest ecommerce companies have been de-growing volumes with 3rd party logistics players like Delhivery Ltd, volumes from D2C companies like Nykaa have been growing for Delhivery Ltd. As a result the share of business from the top 5 customers has reduced over the last few years for Delhivery Ltd.
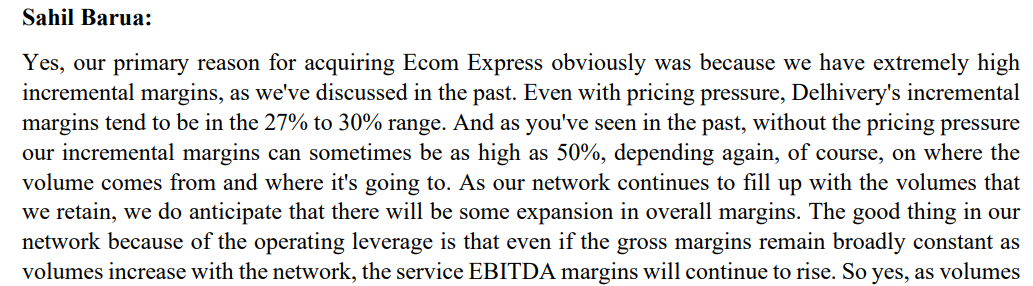
There is intense competition in the express parcels ecommerce segment. Apart from the captive companies, XpressBees, ECom Express (now acquired by Delhivery Ltd) and Shadowfax have been major competitors of Delhivery Ltd in this segment. This has led to immense price competition and reducing realisations and margins in recent years. Management expects the intensity of competition and price cuts to gradually abate as it believes that present cost economics are not sustainable for most competitors (borne out by the distress sale of Ecom Express). Management also believes that the trend of insourcing by ecommerce companies has peaked as unit economics for captive logistics companies are not favourable. If Delhivery Ltd management is right on both counts, then the express parcels segment of Delhivery Ltd should see 15-20% growth with service line EBITDA margins improving to 18-20% in the years to come.
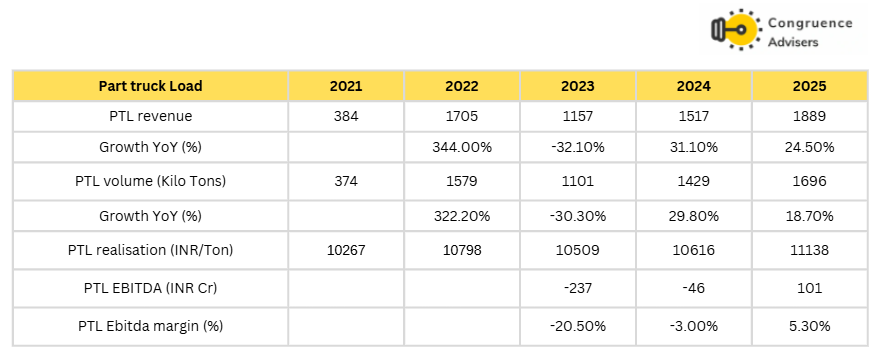
2. Part truck Load – This is a primarily B2B business segment, wherein an organization wanting to send a less than truckload consignment can book its consignment with a 3rd party logistics company like Delhivery Ltd. Delhivery Ltd collects the consignment from the client and pools together many such consignments at its gateway/hub, sort consignments by destination gateways/hubs, consolidates consignments going to the same destination on a single truck and then follows it up with a de-consolidation and last mile delivery process at the destination hub/gateway. Part truck load freight is more profitable than full truck load freight because of the value added service offered to the customer. The balance of power also rests with the logistics company since the customer is not able to offer enough consignment to fill a full truck.
Delhivery Ltd had a small PTL business line of its own prior to 2021, but the segment really took off after the 2021 acquisition of Spoton Logistics. The acquisition took some time to get digested, leading to expanding losses in FY23. But FY24 onwards the business has settled down and in FY25 it reported a service line EBITDA margin of 5.3%, a YoY EBITDA margin swing of 830bps. In fact in Q4 FY25, this vertical reported 11%+ EBITDA margins. One can hope that the PTL segment will continue to grow at 20%+ YoY while expanding margins to mid-to-high double digits levels over the next few years.
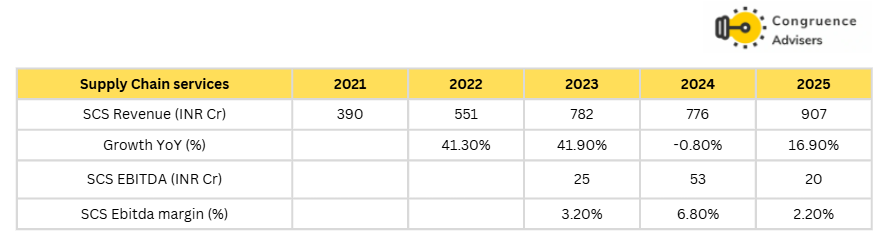
3. Supply Chain services – Under this segment, Delhivery Ltd provides end to end logistics fulfilment services to its clients, starting from warehouse management to order fulfilment. This segment is still nascent in size, although its service-line-EBITDA positive for the last 3 FYs. Management has said that the segment needs to scale to INR 2000 Cr revenues before achieving a respectable profitability level.
4. Full truckload Services and Cross Border Services – The last two segments are also the smallest. The two segments together are at neutral service line EBITDA levels currently.
Under the FTL segment, Delhivery Ltd provides full truckload services for customers. FTL is a commoditised segment as clients hold disproportionate negotiation power on rates by virtue of booking the entire vehicle. It is unlikely that Delhivery Ltd will want to scale this segment too much or even if it does, it is unlikely that it will make sizable profits in this segment.
Under the cross border services segment, Delhivery Ltd offers international express parcel shipping in partnership with FedEx and Aramex. As part of the partnership with FedEx, FedEx invested USD 100mn in Delhivery Ltd and Delhivery Ltd handles FedEx’s domestic last mile services in India and vice versa, international parcels booked from India by Delhivery Ltd are serviced by FedEx’s global network.
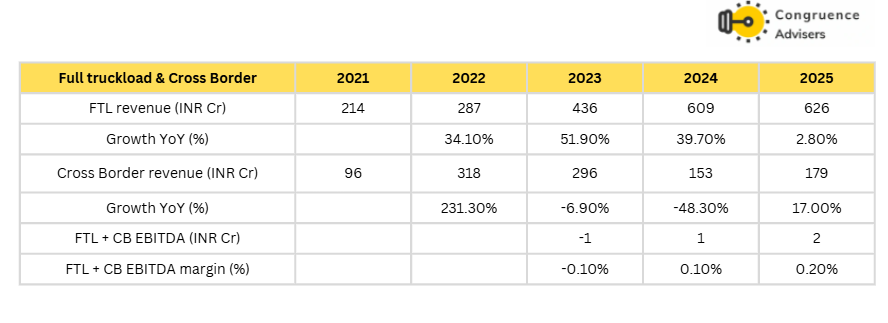
From a near term perspective, it is the PTL and express parcels segments that matter. From a medium term perspective, the supply chain services segment can also start contributing to profits. The FTL and cross border services segments are unlikely to scale meaningfully for Delhivery Ltd in the near to medium term.
Journey towards profitability
As you can see from the table below, between FY21-FY25, a few things have consistently happened for Delhivery Ltd – 1. Service EBITDA margins levels have consistently increased demonstrating operating leverage at the service level and 2. Overhead costs have stopped growing on an absolute basis over the last 3 years, leading to operating leverage at the corporate overheads level as well.
These two consistent trends have swung the adjusted EBITDA margin from -6.9% in FY21 to 1.7% in FY25. As revenues continue to increase, both these levels of operating leverage should continue to play out, expanding adjusted EBITDA margins much more in the coming years.
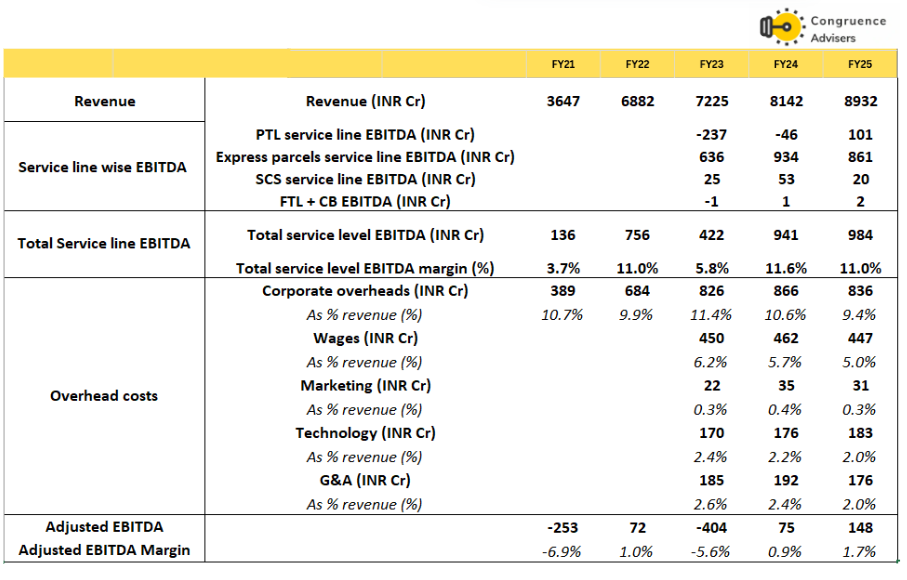
Management has highlighted multiple times in investor conference calls, that incremental volumes filling the network have very high EBITDA margins, which should start reflecting in increased adjusted EBITDA margins for Delhivery Ltd as volumes scale higher.
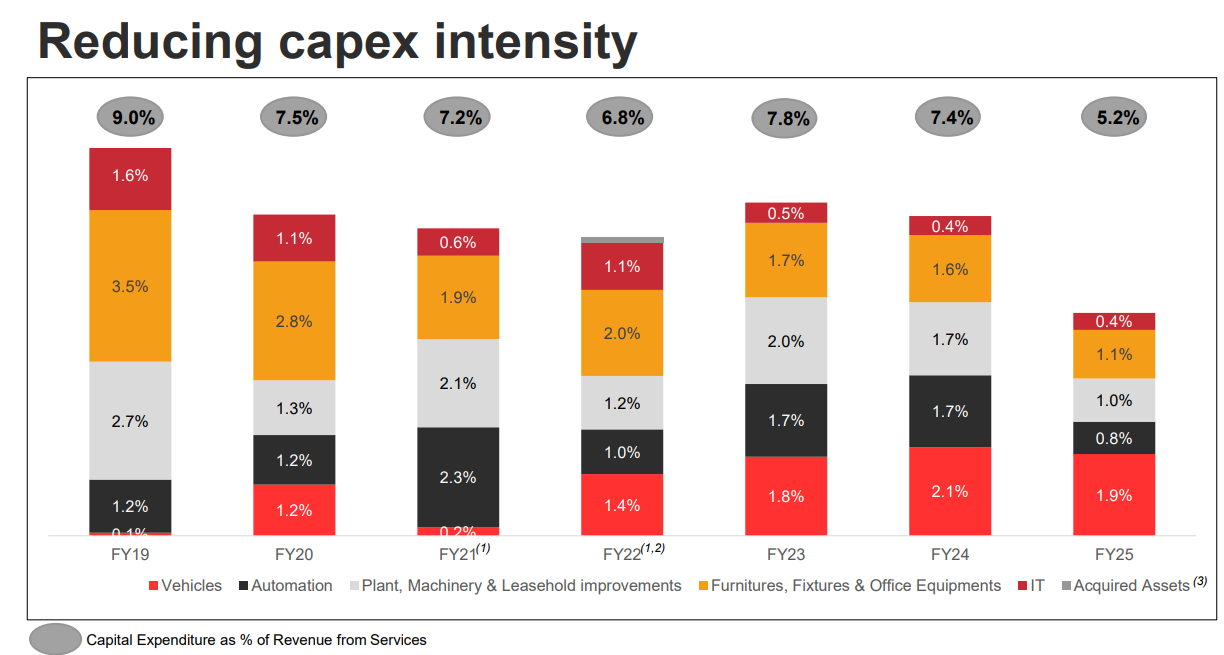
Management has also guided that with most of the network level capex already done at a pan India level, incremental capex will be directed more towards fleet augmentation rather than fixed network elements such as gateways and sorters. Thus management expects capex/revenue to reach 3.5-4% levels in the coming few years. This should aid free cash flow generation in the coming years.
Ecom Express Acquisition
Delhivery Ltd expects the Ecom Express acquisition to be much smoother than the Spoton Logistics acquisition as illustrated below. Delhivery Ltd expects to incur ~INR 300Cr of integration costs, primarily linked to locked-in lease costs which have to be seen out.
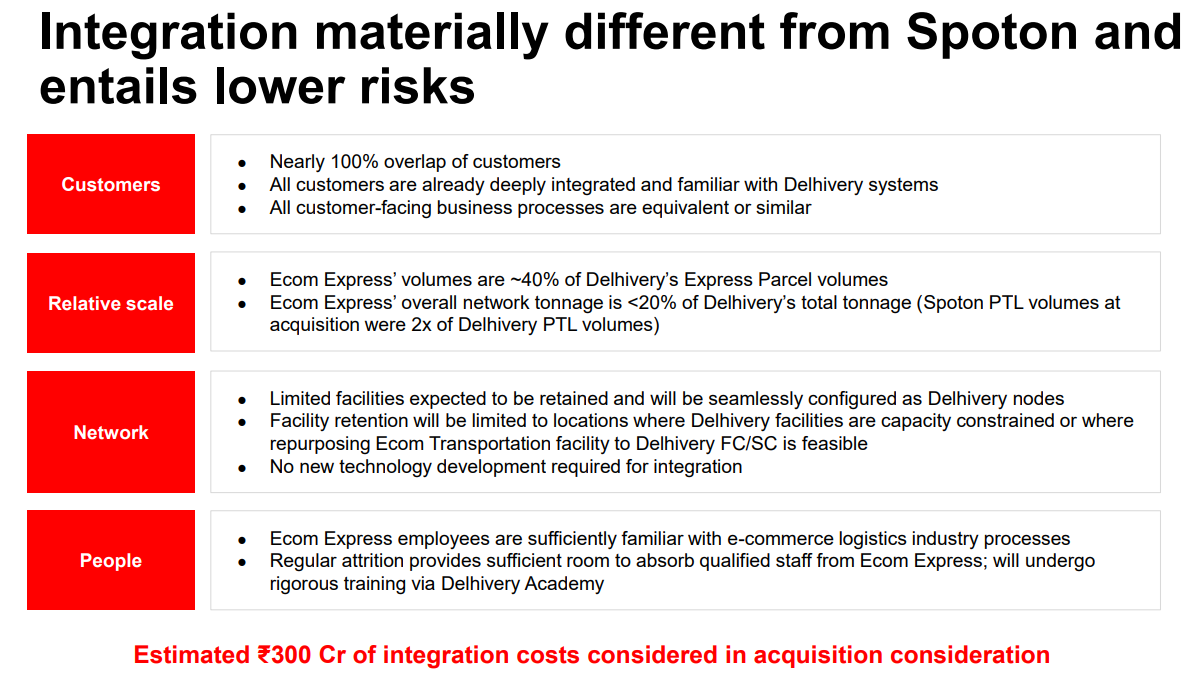
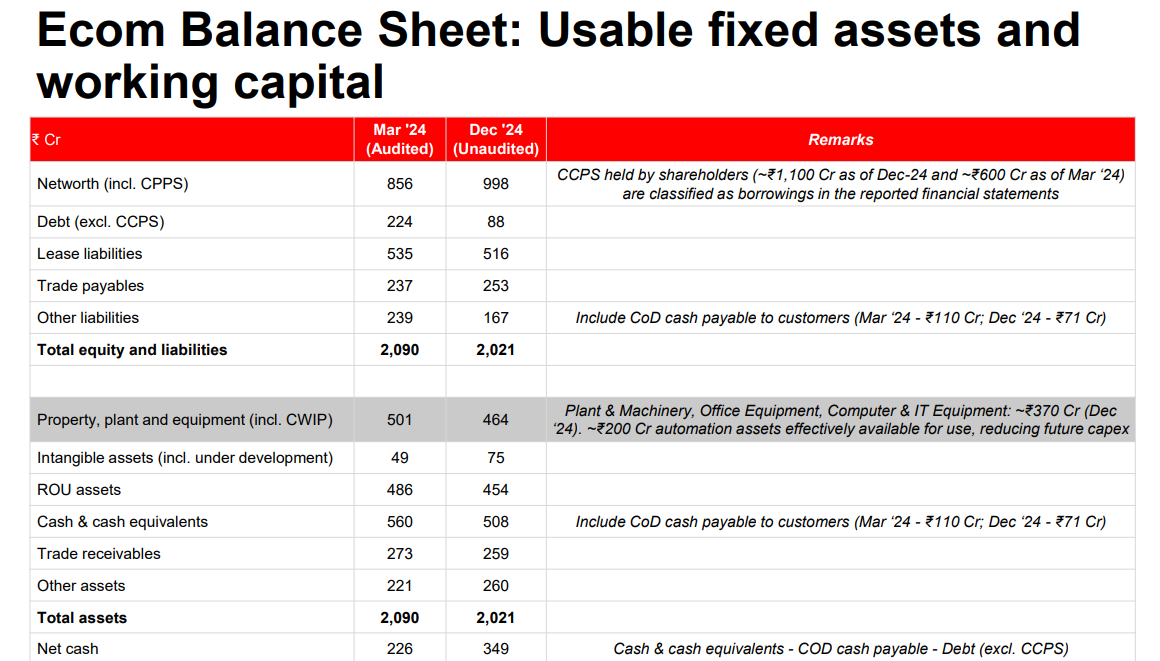
Delhivery Ltd expects to be able to put to use ~INR 370Cr worth of fixed assets from the Ecom Express balance sheet, including ~INR 200Cr of automation assets which will reduce future capex requirements for the company. In addition, Delhivery Ltd will be able to access ~INR 350Cr of net cash from the balance sheet. Therefore, against the acquisition price of ~INR 1400Cr, Delhivery Ltd expects to recoup ~INR 700Cr worth of cash and tangible assets. The remaining 700Cr of the acquisition value will presumably have to be recovered via synergy gains and realization and margin improvements.
Delhivery Ltd. corporate governance analysis
- Board Composition – Delhivery Ltd’s Board comprises 10 members, of whom only 3 are Executive members whereas 7 are Independent members. The Chairman of the Board is also an Independent member. Thus Delhivery Ltd.’s Board seems to be robustly independent. The Board is littered with ex and present CEO’s of illustrious companies.
- Promoter remuneration – Delhivery Ltd does not have a promoter as such. However, Mr. Sahil Barua is the founder of Delhivery Ltd. and Mr. Suraj Saharan, Mr. Kapil Bharati and Mr. Mohit Tandon are co-founders. Hence, they can jointly be considered to be promoters. Their remuneration in FY24 amounted to a whopping INR 120 Cr. But this amount includes the value of vested ESOPs. Ex of the value of vested ESOPs, the joint remuneration amounted to ~INR 11 Cr.
- Related Party Transactions – There are no related party transactions worth mentioning.
- Contingent Liabilities – The total contingent liabilities of Delhivery Ltd. amount to INR 34 Cr in FY24, related to income tax demands. This amounts to ~0.3% of the Delhivery Ltd’s FY24 net worth and is hence not material.
- Dividend Policy – Delhivery Ltd has no dividend policy and does not declare dividends as of FY25. This seems prudent as Delhivery Ltd is in its growth phase and cash generated from operations can find good usage for business purposes.
Delhivery Ltd Financial Performance
Since FY19, Delhivery Ltd. has grown revenues and EBITDA at handsome CAGRs of 33% and 35% respectively, demonstrating strong growth in business volumes. However, due to high fixed costs and investments, until recently Delhivery Ltd was reporting negative EBITDA and PAT. Only in FY24, Delhivery Ltd finally reported positive EBITDA and in FY25 Delhivery Ltd has finally reported positive PAT.
Working capital days have been steady around 25-30 over the years and net fixed asset turns have also stabilised at 2.3-2.4x levels since FY22, after the acquisition of Spoton Logistics. Delhivery Ltd has a huge cash balance of ~INR 5500Cr as of FY25.
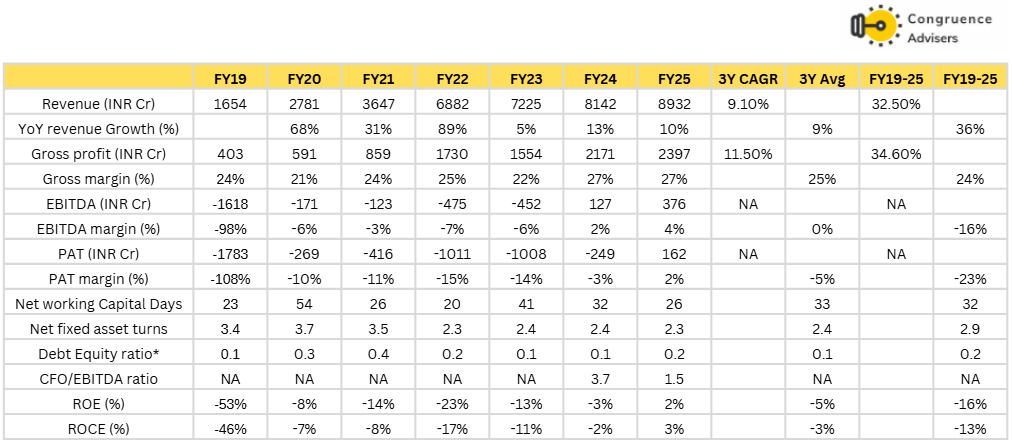
* includes lease liabilities as part of borrowings
Over the last 2-3 years, two major changes have happened in Delhivery Ltd’s financials. One, revenue growth has slowed down significantly to high single-digit or low double-digit levels and fixed costs (corporate overheads) have stopped growing significantly.
Revenue growth has slowed down since FY23 for two major reasons – one, there have been no major acquisitions since FY22 (Ecom Express was acquired in FY25, which should reflect in FY26 growth) and two, because the largest business segment of express parcels has seen tepid growth since FY23. The reason for slowdown in express parcels growth since FY23 has been the shift of volumes by e-commerce majors (Amazon, Flipkart, Meesho) from 3rd party logistics players like Delhivery Ltd to their in-house, captive logistics companies such as eKart (Flipkart), ATS (Amazon) and Valvo (Meesho).
Hence, the most important variable for Delhivery Ltd. to deliver (no pun intended) a robust performance over the next few years, is recovery in express parcels volume growth. Management has consistently said that the peak trend of in-sourcing parcel volumes by e-commerce companies is behind us and they expect express parcel volumes to grow at ~15-20% per annum in a steady state for several years.
As investors, we need to see if these assertions by Delhivery Ltd. management are indeed true. If they are, then we can hope to see significant operating leverage in Delhivery Ltd’s financials in the years to come, as corporate overhead costs seem to have reached a steady plateau over the last 3 years.
Delhivery Ltd Comparative Analysis
To understand Delhivery Ltd investment potential, we have conducted a comprehensive analysis. This analysis includes comparing Delhivery Ltd to its competitors (peer comparison) on various fundamental parameters and Delhivery Ltd share performance relative to relevant benchmark and sector indices.
Delhivery Ltd Peer Comparison
We are comparing Delhivery Ltd. with its peers in the express parcel, full truck load and part truck load segments. Hence we have considered Blue Dart Express, VRL Logistics and TCI Express for the peer comparison. We haven’t included Allcargo Logistics, as its revenues are majorly derived from ocean logistics and CFS and port clearance services which are not relevant to Delhivery Ltd.
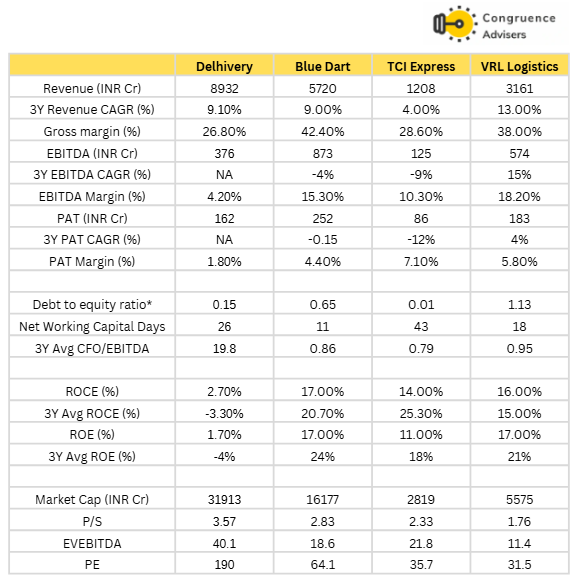
Overall revenue growth for all the players has been tepid over the last 3 years with the exception of VRL Logistics. Blue Dart and TCI have seen significant margin compression over the last 3 years while VRL and Delhivery Ltd have expanded margins. All 4 players have comfortable debt coverage metrics and generate healthy operating cash flows while maintaining sound working capital discipline.
Delhivery Ltd’s peers have much higher profit margins and robust ROCE and ROE metrics on a comparative basis. This is likely due to the mature nature of their networks compared to Delhivery Ltd which is still in the process of utilising its built out network.
On a valuation comparison, Delhivery Ltd is comfortably the most expensive stock whereas VRL Logistics is the cheapest.
Delhivery Ltd Index Comparison
Delhivery Ltd share performance vs S&P BSE Small Cap Index, as the index benchmark comparison is a fundamental tool for understanding the investment potential and making informed decisions in the context of the broader market
Why you should consider investing in Delhivery Ltd.
Logistics has a very large TAM in India – The logistics industry in India is huge, with the total industry size projected to reach USD 500 bn+ by 2026. Logistics spend constitutes 13-14% of India’s nominal GDP, much higher than that of developed countries. There is a strong Government focus on trying to reduce logistics costs as % of GDP. New age companies like Delhivery have a big role to play in this journey as they can drive cost efficiency in Indian logistics. Thus, it is not unfair to expect logistics industry leaders like Delhivery to have large terminal values and thus command premium valuation multiples.
Technology enabled logistics is the way forward – Technology driven innovation and cost efficiency are going to be the major drivers in reducing India’s logistics cost as a % of nominal GDP. Delhivery Ltd, being a new age company formed in 2011, has technology as part of its DNA and is thus an industry leader with regards to technology enablement in the Indian logistics industry. This capability will give it operational advantages compared to its peers.
Strong network effects and cost economics – There are only a handful of truly pan India logistics players in India such as Delhivery Ltd, Allcargo Group, Blue Dart, Mahindra logistics, TCI Group etc. Delhivery Ltd is prime amongst them. Delhivery Ltd’s large network infrastructure consists of 20mn square feet of logistics floor space, 111 national gateways/hubs and 45 automated sorting centers in addition to the numerous large and medium sized transport vehicles owned and leased by it. This vast network of key assets which are either owned or leased provide it an unparalleled network effect and superior cost economics. As the established network gets incrementally filled with traffic, the network becomes more efficient and cost to serve customers drops even more.
High chances of operating leverage playing out – As Delhivery Ltd has built out the pan India network over the last few years, its incremental annual capex spends have started reducing. Capex as % of revenue has reduced to 5.2% in FY25 from 9% in FY19 and management expects it to settle down to 3.5%-4% of revenues over the next few years. As further network build out comes to a halt and focus on juicing the existing network by increasing utilisation, Delhivery Ltd. should see significant operating and financial leverage play out via the P&L line items of employee expenses, interest costs and depreciation costs (Bear in mind that interest and depreciation costs for Delhivery Ltd include operating costs such as vehicle and lease rentals due to the vagaries of IND AS 116 accounting). In FY25, these 3 P&L line items amounted to ~23% of revenue, a very significant number.
High cash balance enabling rich optionalities – Delhivery Ltd. has a huge cash balance of ~INR 5500 Cr which provides it with multiple optionalities to drive future growth and efficiencies via inorganic acquisitions or via technology acquisitions. No other peer in the industry has anywhere close to Delhivery Ltd’s war chest, which lends Delhivery Ltd a distinct growth advantage.
What are the Risks of investing in Delhivery Ltd.
Very rich valuations – For all the positives, there’s no denying that at a ~INR 32000 Cr market cap, Delhivery Ltd. is very richly valued. v currently trades at ~185x TTM EV/adjusted EBITDA. Even if adjusted EBITDA were to jump 5x in the next 3 years, Delhivery Ltd is still trading at ~35x 3-year-forward EV/adjusted EBITDA. Even for a company with as formidable prospects and leadership positioning as Delhivery Ltd, these valuations seem to be demanding.
Continuing trend of insourcing by e-commerce biggies can challenge parcels growth – Management’s present assumptions seem to be that the in-sourcing trend by large ecommerce companies has peaked and from here on there will be a steady market dynamic between insourced and outsourced express parcel volumes. If this assumption does not hold and existing as well as up and coming ecommerce companies continue to in-source a higher % of their volumes, then this might challenge Delhivery Ltd.’s assumptions of 15-20% steady state growth in the express parcels segment.
Trying to do too many things all at once – Delhivery Ltd is operating across 5 verticals – express parcels, PTL, FTL, SCS and cross-border logistics. It has built scale only in the first two segments while the remaining three remain subscale. While all the 5 business segments utilize the common network infrastructure of Delhivery Ltd, the customer dynamics, nature of freight and success metrics in each line of business appear to be sufficiently different from each other. Therefore, there is a danger that in trying to grow all 5 business segments, Delhivery Ltd management’s focus on the top two segments – express parcels and PTL – gets diluted, resulting in hits to profitability.
Ecom Express acquisition being a drag on near term performance – While the Ecom Express acquisition and integration is likely to be much simpler than the Spoton acquisition in 2021 due to the differences in size relative to Delhivery Ltd’s base business in each segment, there are still chances of unforeseen losses happening. While management claims it has only assumed a 30% volume retention from the Ecom Express network to build its acquisition business case, it remains to be seen how much volumes can eventually be retained given that clients will be wary of consolidating their logistics business with one supplier i.e. Delhivery Ltd. Management has dampened investor expectations of increase in parcel yields following this consolidation as it seeks to keep costs low for customers to deepen its moat vs peers. Also, given that the plan for Delhivery Ltd is to eventually liquidate most of the Ecom Express assets and retain only key technology assets (Worth ~200Cr as per management) and some network assets which provide synergy, it remains to be seen whether the amount paid for acquiring Ecom Express will get justified or not over time.
Quick commerce could be a threat – The rising trend of quick commerce in India could be a potential threat to Delhivery Ltd’s business economics and profitability trajectory in the near to mid term.
Quick commerce fulfilment requires a different kind of fulfilment strategy compared to ecommerce. An ecommerce consignment will usually traverse long distances solo, be routed across multiple gateways before reaching the last mile delivery network where fulfillment happens over a matter of hours (6-12 hours). A quick commerce consignment on the other hand will usually travel in bulk from a brand warehouse to a city warehouse and from there to local area dark stores before moving for last mile fulfillment usually in a 2W and within a matter of minutes.
If more brand volumes move from ecommerce to quick commerce, then the nature of infrastructure required to service that demand is likely to be different from Delhivery Ltd’s existing infrastructure. There may be more investments needed for last mile fulfilment while some of Delhivery Ltd’s mid mile assets may get underutilised. This can push out operating leverage and margin expansion further into the horizon.
Delhivery Ltd Future Outlook
Let’s tie everything together and look at the big picture. Delhivery Ltd seems to have put its high capex phase of life behind itself and is seemingly embarking on an asset-sweating journey in the coming few years. Most of the fixed infra capex as well as permanent human resources at corporate and branch levels is in place for its pan India operations and any incremental capex will mostly be towards fleet augmentation. This sets the base for operating leverage to play out if healthy revenue growth continues and gross margins remain steady.
It can be deduced from management’s commentary in investor conference calls that it expects express parcel growth to return to mid teens levels soon as the insourcing trend amongst ecommerce companies peaks and D2C volumes take over. The PTL segment is also expected to keep growing at 20%+ annually. Taken together, these two segments should then be able to drive 15-20% annual volume and revenue growth.
If 15-20% revenue growth meets steady gross margins and fixed costs that remain fixed, then there is significant scope for operating leverage to play out in Delhivery Ltd. over the next several years. The fixed cost base seems more clear to us, what we are keen to find out is whether express parcels growth can come back to 15-20% levels and how quickly.
Delhivery Ltd Technical Analysis
We consider technical analysis to be a useful input in taking medium-term investment decisions. Many a time, price action tends to lead to fundamental developments; this is too important an aspect to be ignored by retail investors who do not have access to management outside of common forums like investor calls & AGM.
At Congruence Advisers, we like to consider both the long-term weekly chart and the daily chart to arrive at a view on price action. Combined with our understanding of fundamentals, we usually end up being better placed to be able to judge both the business cycle and the stock cycle. Playing the stock cycle right is extremely important for investors looking to extract significant alpha over the medium term.
Delhivery Ltd Price charts
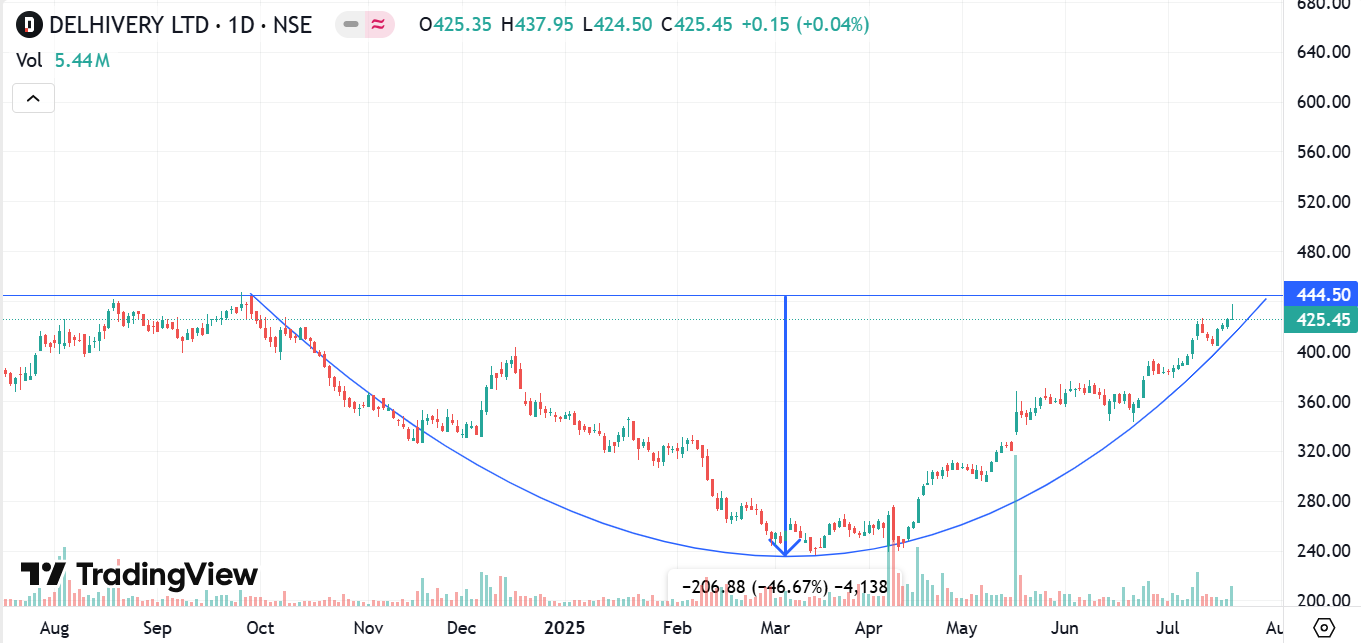
On the daily chart, Delhivery Ltd stock has formed a pattern similar to a cup formation. The depth of the cup is about 207 points, suggesting a potential price target of 651 if the pattern were to play out. The long volume candle and gap up on 19th May 2025 was the reaction to the Q4 FY25 results. The gap region of 328-332 should provide strong support. The 50DMA, 100DMA and 200DMA levels are currently at 373, 350 and 348 respectively. Delhivery Ltd stock seems stretched at an RSI level of 74. We expect Delhivery Ltd stock to consolidate around the resistance level of 445 before breaking out depending on business performance. Some consolidation and base formation around 445 (Perhaps a cup and handle?) should bode well for future up moves.
Delhivery Ltd Latest Result, News and Updates
Delhivery Ltd Quarterly Results
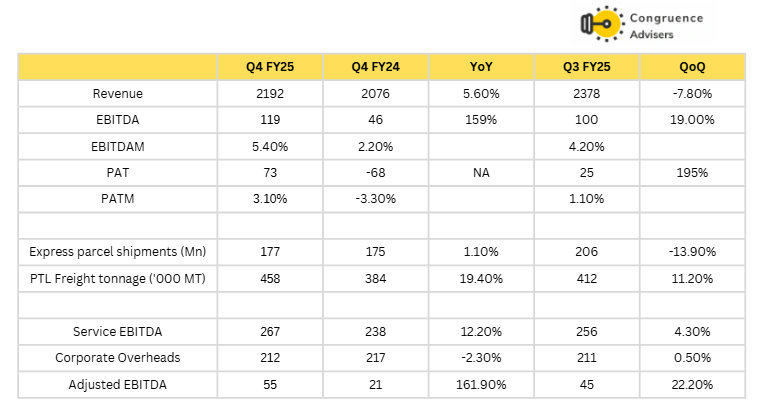
Delhivery Ltd reported strong Q4 FY25 numbers. While revenue grew only 5.6% YoY, EBITDA grew 159% YoY and Delhivery Ltd reported a PAT of +74 Cr vs a PAT of -68 Cr in the year ago quarter. Express parcel shipments remained largely flat YoY but PTL tonnage showed an impressive 19.4% growth YoY and 11.2% growth QoQ, demonstrating sustained business momentum in this segment.
Service level EBITDA increased by 12.2% YoY and 4.3% YoY
Disclaimer – This note is part of a business research & analysis series on small companies, there is no BUY/SELL recommendation or target price issued as part of this to a general audience. There is no assurance that this stock makes for a good investment, there is no guarantee that this stock will continue/be included in the coverage universe of Congruence Advisers. The note contains some forward-looking statements and insights drawn from the historical results, annual reports and investor presentations; they are to be viewed only within this context and not as a prediction of future performance of the business or the stock covered.
While due care has been taken to ensure that the information here is as accurate as possible, Congruence Advisers disclaims any liability in case of any unintentional inaccuracies.
The content does not constitute investment advice.