
Operating leverage is one of the most important but least understood drivers of earnings growth in any business. It refers to the phenomenon where profits grow at a much faster rate than revenues once a company begins to utilize its existing cost base more efficiently.
For investors, understanding Operating leverage can be extremely valuable because it helps identify companies where future profit growth could meaningfully outpace revenue growth. It shifts the focus away from simply tracking top line growth to understanding how efficiently the existing cost structure can convert revenue expansion into bottom line improvement.
Most professional journeys in the financial markets begin with a heavy dose of theoretical literature—predominantly Western texts that focus on the efficient markets of the US. However, as any veteran of the Indian markets knows, the nuances of the local context are only understood through cycles. After 16 years of navigating these waters, the core lesson is one of evolution. You cannot afford to be static in a market that constantly changes its colours.
At Congruence Advisers, our philosophy is rooted in intellectual humility. We accept that we will be wrong—it is an occupational hazard. The objective is not to achieve a 100% hit rate but to ensure that our “right” decisions carry enough conviction and magnitude to overshadow our mistakes. This requires a focus on forward-looking projections while acknowledging that even the best-laid investment thesis can be sent for a toss by macro or execution risks.
What is Operating Leverage? Why It Matters for Profit Growth
At its core, Operating leverage is a function of fixed costs — the expenses that do not change meaningfully in the short term even if sales increase. In businesses where a large portion of total costs are fixed in nature, such as employee salaries, rent, maintenance expenses or depreciation, incremental revenue does not require proportionate incremental spending. Once these fixed costs are covered, every additional unit sold contributes disproportionately to operating profit. This is where Operating leverage begins to amplify earnings growth.
The strategy we focus on within the theme of operating leverage is about catching the inflection point. It is about looking for the “Holy Grail”—where earnings expansion meets valuation re-rating. This article explores how to identify businesses where Profit After Tax (PAT) growth significantly outpaces revenue growth, creating a non-linear return profile.
To a novice, a company growing revenue at 15% is “good.” To an experienced investor, that 15% revenue growth is only interesting if it leads to 20% or 25% PAT growth. This is the essence of Operating Leverage.
The Double Engine of Alpha
- The Internal Engine (Earnings Expansion): This occurs when the cost structure of a business allows incremental sales to flow disproportionately to the bottom line.
- The External Engine (Valuation Re-rating): When the market sees profit growth accelerating from 15% to 40%, it rarely keeps the P/E multiple the same. A company trading at 20x P/E may suddenly be bid up to 40x because the quality and velocity of earnings have changed.
The “Holy Grail” is finding this combination: Operating Leverage + Reasonable Starting Valuation. If you pay 80x earnings for a company already in peak leverage, you have no “valuation engine” left to fire. The goal is to find companies where the market hasn’t yet priced in the margin expansion.
But first, we will need to start with some basic concepts and constructs.
Watch the video here
Basic concept of Operating Leverage: The Margin Bridge
To understand Operating leverage in practice, it helps to visualize the margin bridge between revenue and net profit.
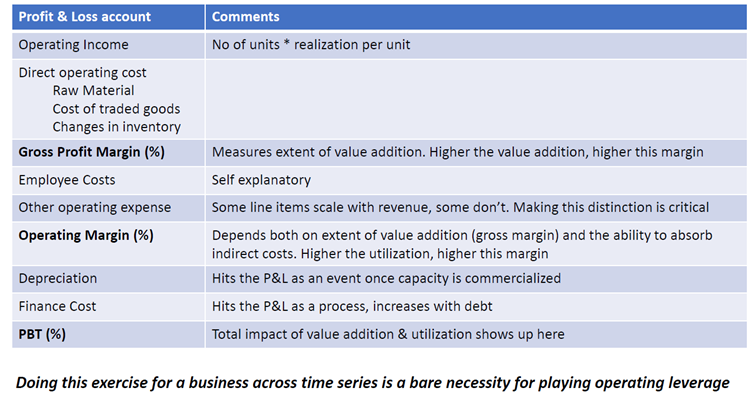
Revenue is first reduced by direct costs such as raw materials or traded goods to arrive at gross profit. This component of the cost structure tends to move in line with production volumes and therefore has limited impact on Operating leverage unless the product mix changes tangibly and can lead to sustainable increase in the gross margin. This we believe is one of the most powerful ways operating leverage can play out, though it is not common.
The real impact of Operating leverage usually begins below the gross profit level. Indirect costs such as employee expenses, administrative overheads, legal costs, marketing expenses and rentals are often fixed or semi fixed in nature. These costs may remain largely unchanged across a wide range of output levels, especially in the short to medium term.
As revenues begin to grow without a proportionate increase in these indirect expenses, operating margins expand. Operating leverage ensures that incremental revenue flows through to operating profit more efficiently, thereby driving non‑linear growth in earnings even if revenue growth appears modest on the surface.
Next, we will drill deeper into the margin bridge and examine each element with practical examples
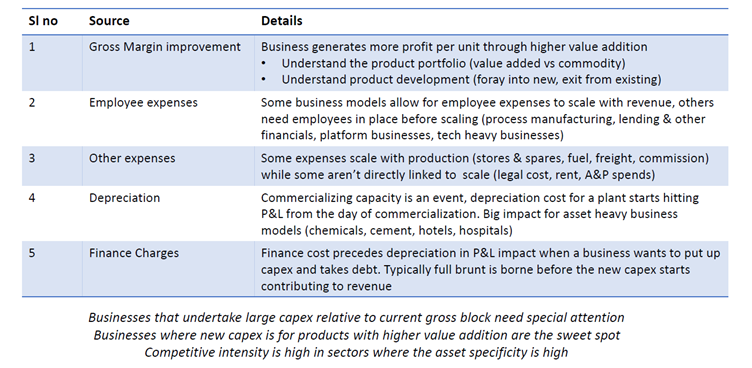
Sources of operating leverage
Operating leverage can emerge through various sources
- Gross margin improvement
- Employee costs
- Other expenses
- Interest cost
- Depreciation
Looking at each one in more detail
Gross Profit Margin: The Value Addition Litmus Test
The Gross Margin is the single best indicator of a company’s competitive position. It measures the intensity of value addition. One of the most common sources is gross margin expansion driven by a change in product mix. When companies shift towards higher value-added offerings or exit low‑margin segments, even stable revenues can lead to significant improvement in profitability due to Operating leverage.
- Low Gross Margin (15-20%): Typical of commodity-like businesses or standard contract manufacturing. Here, you are a “price taker.” To generate leverage, you need massive, almost unattainable volume growth. Or we would need to see a product portfolio that is evolving in favour of higher margin products that can increase the organization wide gross margin over time.
- High Gross Margin (40-60%): Found in specialized manufacturing, proprietary APIs, or strong brands. These businesses have high “contribution.” For every extra rupee of sales, 60 paise is available to cover fixed costs. Such businesses have low asset turnover since the fixed investments (capex) needed to build capability are expensive and need high upfront investments. Operating leverage is usually found in such businesses where higher capacity utilization brings the ability to spread costs over larger number of units and spike the bottom line in a non linear manner beyond a threshold
Indirect Cost Absorption (The EBITDA Journey)
Once Gross Profit is established, we encounter the “Fixed Cost” barrier. In the Indian context, these are primarily:
Employee Costs: Many modern Indian firms (especially in Tech, R&D, or Sales) must hire 6-12 months ahead of revenue. These costs are fixed in the short term but “lumpy.” In many industries, workforce hiring occurs in anticipation of future growth. Once demand begins to rise, the same workforce is able to support higher levels of production or service delivery, resulting in better absorption of employee costs.
Other Expenses: Rent, administration, and basic utilities. Once a new facility is established, rent becomes a fixed expense irrespective of the current scale of production. Some legal & professional costs occur upfront even before the new facility produces one single unit of sale.
The Threshold Scale: This is the magic number. It is the level of sales where Gross Profit exactly covers Employee and Admin costs. Every single rupee of sales (and hence gross profit) above this threshold flows almost entirely to EBITDA (excluding variable costs like freight or commissions).
Below EBITDA: The “Hidden” Barriers
This is where the most significant mispricing occurs. Depreciation and Interest are often treated as “non-cash” or “fixed” by retail investors, but for a professional, they are the timing keys.
- Depreciation is an “Event”: It hits the P&L in full the day a plant is commissioned.
- Finance Cost is a “Process”: It typically scales during construction and then sits heavily on the P&L until the debt is paid down.
Precursor to Operating Leverage – A bad business cycle
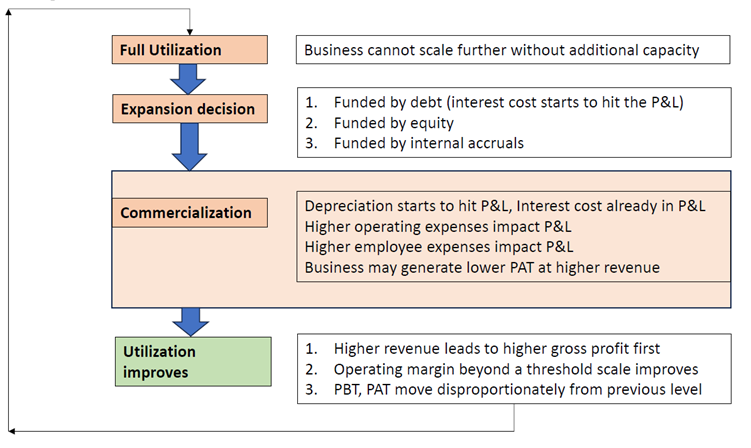
Operating leverage often emerges in phases following a period of investment or expansion. When companies undertake capital expenditure to increase capacity, they incur higher depreciation and interest costs before the new assets begin generating revenue. During this period, profitability may appear subdued despite stable or improving sales and higher gross profit.
As commercialization begins and capacity becomes operational, revenue growth starts to pick up. However, the cost base has already been established through earlier investments. This creates the ideal environment for Operating leverage to take effect as incremental revenues do not require equivalent increases in some of these expenses.
Over time, as utilization levels improve further, Operating leverage leads to sharp expansion in operating margins. Profits begin to grow at a faster pace than revenues, often resulting in a phase of strong earnings momentum that may not have been visible during the investment phase.
As an investor, you must recognize the four phases of the capacity cycle:
- Phase 1: Peak Utilization: The company is at 95% capacity. Margins are brilliant. The stock is likely at an all-time high. But the company is “stuck”—it cannot grow without new capex.
- Phase 2: The Commitment: Management announces a large plant. The market cheers.
- Phase 3: Post-Commissioning: The plant opens. Suddenly, depreciation of ₹50 Cr and interest of ₹30 Cr hit the P&L annually. However, the plant is only at 20% utilization. Revenue is up 10%, but PAT crashes 20%. This is when impatient investors sell, and the sophisticated investors start getting interested.
- Phase 4: The Inflection Point: Utilization moves from 20% to 50%. The ₹80 Cr of new fixed costs (Depreciation + Interest) is now being “absorbed.” This is where the non-linear profit spike occurs.
Businesses can sometimes spend many quarters in the muted PAT growth phase post commissioning if the management team gets the expansion timing wrong. Think chemicals sector in FY22 and FY23 where most businesses announced & commissioned large capex only to be met with muted demand and a collapse in gross margin after an excellent phase in FY21 and FY22. As a rule, businesses that are undertaking a large capex relative to their current gross block need to be studied very well.
In a philosophical sense, night precedes day and day precedes night. Understanding this cycle well at the business level and having a view on what the market is currently pricing in is the nuance that the theme of operating leverage demands from investors.
Both business building and investing require learning to live with uncertainty. Every entrepreneur must make decisions today without having complete visibility about tomorrow. Capital expenditure, for instance, has to be committed well before the benefits begin to show. There is often a period of one or even two years when the financial results do not fully justify the investment. During this phase, the numbers may appear underwhelming, and the decision may even seem premature in hindsight.
However, this willingness to act despite uncertainty is at the heart of entrepreneurship. Growth does not come from waiting for perfect clarity; it comes from taking informed risks and building capacity ahead of demand. The temporary mismatch between investment and visible returns is not a flaw in the process—it is an inherent part of it.
As investors, we need to recognize and appreciate this reality. Not every investment will produce immediate results, and short-term financial performance does not always capture the long-term potential being created. Understanding this principle helps us evaluate businesses more thoughtfully and with greater patience.
These are the foundational ideas that guide both entrepreneurship and investing: accepting uncertainty, committing capital with conviction, and allowing time for outcomes to unfold.
Operating Leverage: Why do we like this theme?
Operating leverage is a theme we prefer because it allows us to benefit from business growth with relatively lower downside risk—provided we give it the right amount of time.
When we focus on businesses where operating leverage is likely to play out, we typically look for the following:
Businesses We Understand Well
- We apply this approach to companies that we have tracked over several years.
- It is easier to evaluate a familiar business than one we do not know well.
- Historical data on growth, profitability, and returns helps us form a clearer view.
- With this understanding, it becomes easier to estimate financial performance over the next few quarters
It would be very difficult to play the theme of operating leverage in sunrise sectors where the unit economics and long-term ROCE trend are yet to be established.
We know the factors to track and obsess over
- The company’s long-term growth potential.
- The tendency of profitability to move in cycles and return to normal levels over time.
- A clear exit approach once the phase of sharp profit growth begins to slow down.
Once the key set of factors are understood and isolated, basic financial modelling skills can give investors a sense of how the financial statements (balance sheet, profit & loss and cash flow statement) can evolve in response to these changing factors.
Risks That Can Be Reduced through this theme
- Investing when the company’s debt levels are already near their peak helps avoid further balance sheet stress.
- Entering at a time when profitability is at a low point in the cycle often keeps market expectations modest.
- We can rely on past business cycles to understand how long such phases typically last.
- Historical valuation ranges give us a reasonable idea of what may be considered average or peak pricing by the market
An important consideration is the time frame over which we evaluate these indicators. Technical signals and valuation measures only become meaningful when viewed across a full business cycle rather than over a few isolated quarters.
Over time, we accumulate enough data from previous cycles to form a balanced view on key benchmarks such as:
- The average valuation multiple at which the business has traded.
- The typical operating margin it has delivered.
- The usual level of cash flow generated relative to the overall value of the business.
- The peak valuation multiple achieved during strong phases of the cycle.
Having this historical perspective makes entry and exit decisions more structured and disciplined. It allows us to compare the present situation with past patterns, rather than relying on assumptions. This approach tends to be more predictable than investing in businesses where growth is entirely secular and long-term, and where valuation benchmarks are less clear.
Our experience has been that Operating Leverage is a relatively low downside theme that offers a higher than usual probability of success in investing, when done well. It should go without saying that investors will need to have some basic skills (will be elaborated in a subsequent section) and have good clarity on their investment horizon.
To summarize why we prefer Operating Leverage as a theme –
- We believe operating leverage offers relatively limited downside, provided risks are managed carefully at the time of entry.
- If investments are made when balance sheet risk is controlled and expectations are modest, the probability of adverse outcomes reduces.
- The outcome depends on only a few key variables falling into place—primarily improvement in utilization and steady demand.
- Because the drivers are fewer and more measurable, the probability of success can be reasonably assessed.
Operating leverage is attractive because it combines manageable downside with a favourable probability of improvement, especially when supported by historical data and disciplined entry timing.
How to Play Operating Leverage: What indicators should one track?
While investing needs time in the market, one can improve probability of good outcomes by choosing the appropriate time to play this theme. The “timing” here doesn’t refer to overall market timing but more to choosing when to play this theme in a particular business that one has done the work on.
So how do we know when it is a good time to play the theme of operating leverage in a business? We essentially look for three clusters of signals
How do you know the “Night” is ending? We look for three clusters of signals:
| Category | Indicators | Insight for Investors |
| Business | Peak Asset Utilization; Capex funded by internal accruals; Management’s “Confidence Tone.” | High utilization means any new order must be high margin or triggers the need for the next plant. |
| Financial | High CWIP (Capital Work in Progress) relative to Gross Block; Spiking Depreciation; Flat EBITDA/PAT. | A peak in CWIP suggests the “Depreciation Event” is imminent. Watch for the first quarter of revenue ramp-up. |
| Technical | Breakouts from horizontal bases; Relative Strength (RS) vs Sector; 200-DMA support. | Technicals often lead the fundamentals. If the stock stops falling on “bad” earnings (PAT drop), the market is pricing in the future leverage. |
To benefit from operating leverage in a disciplined manner, it is important to track this set of business, financial, and market indicators over time. Elaborating a bit more on each one these clusters
Business Indicators
- Listen for increasing confidence in management commentary, especially as capacity utilization begins to approach higher levels.
- Pay close attention to new capital expenditure announcements and understand how these investments are being funded.
- Track whether newly announced capacity is being completed and made operational within the expected timelines.
- Monitor how quickly the business begins to scale up after new capacity becomes operational.
- Once new investments start contributing to revenue, review utilization levels regularly on a quarterly basis.
Financial Indicators
- Keep track of overall debt levels on the balance sheet.
- Monitor capital work-in-progress (CWIP), which is typically disclosed every six months.
- Look for an increase in depreciation expenses in the profit and loss statement as new assets become operational.
- Observe whether employee costs and other operating expenses begin to rise alongside capacity expansion.
- In the initial phase after new capacity becomes operational, gross margins may remain steady even as operating margins decline.
- Watch for situations where gross profit is improving year-on-year but operating profit remains flat or declines.
Market Indicators
- During favourable market conditions, observe whether the stock price is moving within a narrow range near key resistance levels.
- In weaker markets, or in cases where capacity expansion has been mistimed, look for early signs of price stabilization followed by a breakout supported by higher trading volumes—even if quarterly profit growth has not yet improved.
This approach requires close attention to detail, along with the discipline to build and regularly update quarterly financial models. So please don’t shy away from doing the work it takes. It is not a theme where one can rely solely on the belief that the long-term future of the business is promising.
Even if the long-term outlook is strong, the business may not deliver visible results for the next two to three years. In such periods, it is easy to lose patience and exit prematurely before the benefits begin to appear.
If one chooses to follow this theme, it is important to:
- Build quarterly financial models in advance.
- Regularly compare actual performance against these expectations.
- Assess whether outcomes are tracking better or worse than anticipated.
- Continuously interpret what the stock price may be indicating about future expectations.
Consistent tracking and discipline are essential to stay aligned with the original investment thesis.
Operating Leverage in the Indian equity market – A few case studies
We will now move to the next phase of the article, where we discuss three case studies. The objective here is to understand how the principles covered so far can be applied in real-world situations, and how we have implemented this approach across different types of businesses.
We have selected three companies for this discussion, each representing a different pathway through which operating leverage can emerge:
- Syrma SGS: An electronics manufacturing services (EMS) company. While this is a growth-oriented business, margins can fluctuate significantly due to several external and operational factors. Cash generation may also remain uneven, making it an interesting example where operating leverage can come through improvement in gross margins.
- Greenply Industries: A more traditional operating leverage case. This is a fixed-asset-intensive business, as is typical in the MDF segment. Here, capacity utilization becomes the key variable to track, as it has a direct impact on profitability. We have previously invested in this business during 2023 and 2024 and continue to hold some exposure.
- Indigo Paints: A consumer-facing company that does not rely heavily on fixed assets. In this case, operating leverage is expected to emerge from a different set of drivers, offering a contrast to the earlier two examples.
These three businesses provide a mix of models through which operating leverage can play out. We will now begin with the first case study.
Operating leverage through higher gross margin – Syrma SGS
Let us begin with Syrma SGS, a leading player in the electronics manufacturing services (EMS) space.
When the company first listed, the market was extremely optimistic about EMS businesses. Companies in this segment were delivering strong revenue growth of 25–35%, margins were stable, and earnings were rising broadly in line with sales. Investor sentiment was very positive.
Over time, however, management decided to expand aggressively into the consumer vertical, particularly consumer durables. While returns on capital in this segment were comparable to the rest of the business, profit margins were significantly lower.
- In healthcare and industrial segments, gross margins could reach 26–28%.
- In consumer segments, gross margins were typically only 15–17%.
As the share of consumer business increased, overall profitability began to decline. Importantly, this was not due to poor capital allocation, but due to a change in business mix. From late 2023 onward, the divergence became visible:
- December 2023: Revenue grew 38%, but profit after tax (PAT) declined 41%.
- Over the next few quarters, this trend continued.
- Gross margins fell sharply, reaching 17% in March 2024 and 15% in June 2024.
- Operating margins bottomed out at 3.8%.
Despite strong revenue growth in earlier quarters, profitability had weakened because of the lower-margin mix. Starting Q1 FY25, management clearly communicated a strategic shift. They began reducing exposure to the lower-margin consumer segment and refocusing on higher-margin verticals. This signalled a likely improvement in margins over time, as the business mix would gradually normalize.
By September 2024, the shift became visible in the numbers:
- Gross margin jumped from 15% to 24%.
- Operating margin improved from 3.8% to 8.5%.
- Revenue growth slowed to 17% (as lower-margin business was reduced).
- However, PAT growth turned positive at 24%.
The key change was clear: revenue growth moderated, but profitability recovered sharply.
The stock reacted positively to this improvement. A clear rise in trading volumes around October 2024 indicated renewed investor confidence. The market appeared to recognize that the worst phase might be behind the company. Soon after, the broader market corrected sharply in January and February 2025. Despite continuing to deliver strong results, the stock offered an attractive entry opportunity during this period of general weakness.
At the time of entry:
- The trailing 12-month PAT was around ₹124 crore.
- The stock was trading at roughly 65 times earnings.
Over the following year:
- Trailing PAT increased to ₹242 crore — nearly doubling.
- The valuation multiple remained broadly unchanged.
- The stock delivered approximately 70–80% returns within a year, even though the broader market remained flat
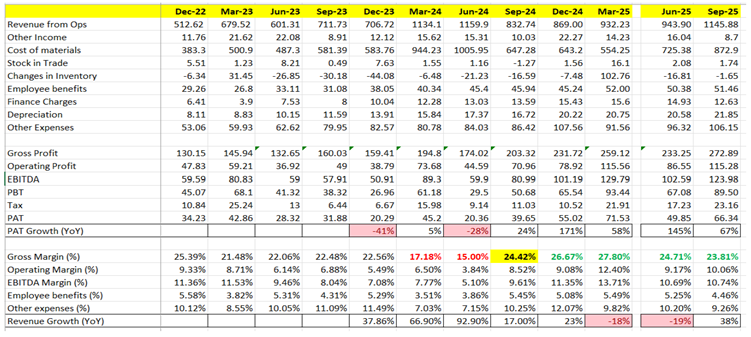
An interesting point during this phase was that revenue growth in March and June 2025 turned negative (–18% to –19%). Yet PAT growth was strong at 58% and 145% respectively.
Under normal circumstances, a 20% revenue decline could severely hurt a stock price. In this case, the market understood that the decline was due to deliberate business restructuring rather than structural weakness. Profitability improved as the mix shifted back to higher-margin segments.
This case illustrates how careful analysis of business mix and margin trends can identify turning points before they are fully reflected in earnings.
When:
- The arithmetic of margin recovery is clear,
- Management communication aligns with financial trends, and
- Market signals confirm stabilization,
the probability of a favourable investment outcome increases significantly. In this example, improved margins — rather than headline revenue growth — became the key driver of returns.
Disclosure: Syrma SGS is a part of one of our research offerings. We are positively biased in favour of the business
Time to cover the next case study from the MDF industry
Operating leverage from higher utilization in a high fixed assets business – Greenply Industries
This example helps illustrate how operating leverage works in businesses with high fixed investments.
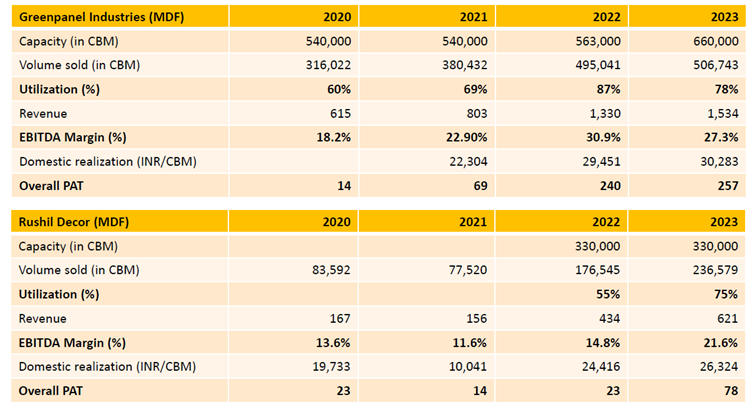
We had studied the previous MDF cycle and examined two companies in detail: Greenpanel Industries and Rushil Decor. Both are primarily MDF players, with some presence in plywood.
Looking at Greenpanel Industries
- In FY20, revenue was around ₹615 crore and profit after tax (PAT) was just ₹14 crore.
- In FY21, utilization increased from 60% to 70%.
- This 10% improvement in utilization led to a sharp rise in operating margins, which moved up by nearly 5 percentage points.
Over the next phase revenue more than doubled, rising from about ₹615 crore to over ₹1,300 crore. Profit increased multiple times over, far outpacing revenue growth.
A similar pattern was visible in Rushil Decor:
- PAT rose from ₹23 crore to ₹78 crore.
- Utilization increased from 55% to 75%.
The message was clear: in high fixed-cost industries like MDF, small improvements in utilization can lead to disproportionately large gains in profitability.
Why Utilization Matters So Much in MDF
MDF manufacturing requires significant upfront investment in plants and machinery. Once the plant is built:
- Fixed costs such as depreciation and interest remain largely constant.
- Profitability remains muted until utilization reaches roughly 60–65%.
- Beyond that level, profits rise sharply as incremental volumes contribute more meaningfully to earnings.
Industry margins also vary based on technology; companies using advanced European technology can earn gross margins of around 55%. Others using lower-cost alternatives may operate closer to 45%. However, regardless of the technology used, the broad principle remains the same: profits expand meaningfully once utilization crosses a certain threshold.
When Is the Right Time to Invest in an MDF heavy business?
Based on our study of the previous cycle, we drew a few practical conclusions:
- The ideal entry point is often after new capacity has been commissioned.
- At this stage, earnings usually look weak due to higher depreciation and interest costs.
- The key is to see clear evidence that revenue will begin scaling up over the next few quarters.
- Without signs of demand picking up, it is better to observe rather than invest
Why Greenply Industries Attracted Us in Late 2023
In FY24, Greenply Industries commissioned new MDF capacity of around 240,000 cubic meters. Management guided for sales of about 100,000 cubic meters in the first year. Production began late in the year, with only a limited number of operating days initially. However, early dispatches were encouraging, especially given strong demand in certain regions.
Importantly:
- FY24 earnings did not show strong growth.
- In fact, reported profit declined compared to the previous year.
- This was expected, as utilization had not yet reached optimal levels.
The real improvement was visible in cash generation:
- Cash profit rose from around ₹65 crore in FY24 to roughly ₹110–115 crore in FY25.
- Certain accounting adjustments affected reported earnings, but underlying cash flow improved.
As utilization crossed the 60% level, profitability began to expand meaningfully. Over the next 12 months, the stock price nearly doubled. This move occurred in a business that was not widely favoured by the market at that time. The improvement came not from rapid revenue growth alone, but from the powerful effect of rising utilization in a high fixed-cost industry.
This case reinforces a simple idea: in asset-heavy businesses, the turning point often comes when capacity begins to fill up. Once that happens, profits can rise much faster than revenue, leading to strong returns for patient investors.
How did we get the entry timing right for this trade?
Looking at the daily price chart at that time: the correction in the stock began around October 2023. The price briefly tested a key support level again in July 2024. It then declined further as reported financial results had not yet started to improve.
At this stage, business indicators were turning positive. Financial performance had not yet reflected the expected improvement and price trends were still weak. In other words, the qualitative outlook had improved, but this was not yet visible in the reported numbers or in the stock’s movement.
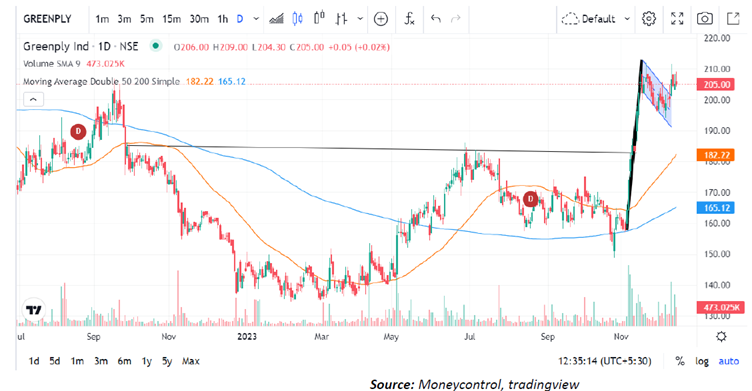
A noticeable rise in trading volumes appeared soon after. This suggested that some investors had started positioning themselves in anticipation of future improvement.
At the same time, management commentary remained confident, rRecent quarterly results were stable and the outlook for the MDF segment over the coming quarters appeared encouraging. This combination of improving business signals and supportive price action indicated that expectations were beginning to shift.
From this real time case study, it should be clear that it is important to
- Combine the fundamental view with observable market trends.
- Look for confirmation that improving business conditions may soon reflect in financial performance.
- Use price and volume patterns as supporting indicators, rather than as standalone signals.
When both underlying business trends and market behaviour begin to align, it can provide greater confidence in the investment decision.
Operating Leverage in a Consumer business – Indigo Paints
We now come to our third case study, which is still ongoing.
We initiated a position in Indigo Paints around July–August 2025. The company had announced a major capacity expansion in 2023 that is expected to double its manufacturing capacity and meet requirements for the next 4–5 years. A large part of this capacity has already been commissioned.
At the same time, the paints industry has faced disruption and slower volume growth. This meant:
- Higher depreciation and employee costs due to recent investments.
- Revenue growth yet to fully reflect the added capacity.
However, two factors provided comfort:
- The company funded this expansion through internal cash flows, keeping balance sheet risk low.
- Advertising spends as a percentage of revenue have reduced over time due to a shift toward digital marketing, helping protect operating margins.
We expect volume growth to recover by FY27, with early signs likely in H2 FY26.
Despite this, we took an early position based on:
- Conservative internal projections indicating that profit growth could outpace revenue growth over the next few years.
- Historical credibility of management commentary.
- Early signs of price stabilization around June 2025.
Following the Q2 earnings call, the stock saw a sharp rise, suggesting early investor positioning. Excerpt from the Q2 FY26 earnings call
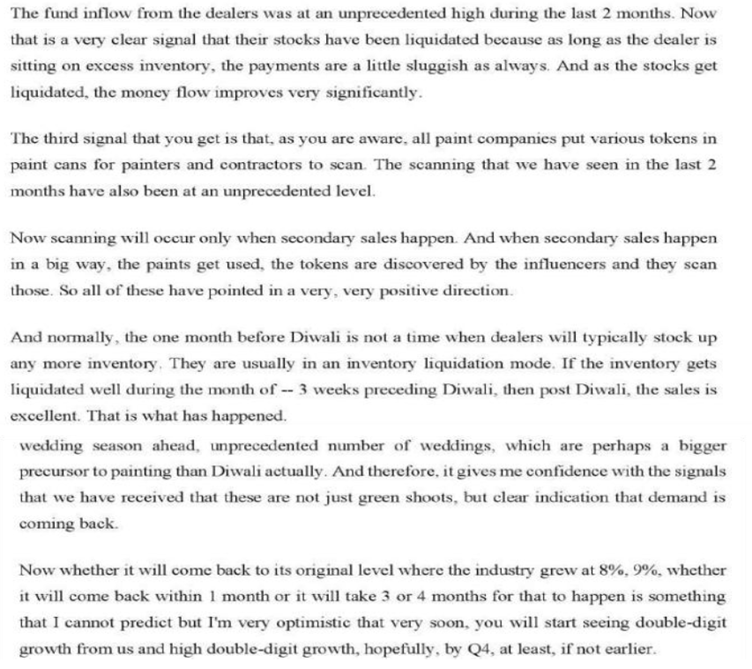
At present, this remains a forward-looking investment thesis. While there is always a possibility of being wrong, the downside risk appears limited given the strong balance sheet and long-term growth potential. In fact, Q3 FY26 numbers indicate that the volume growth appears to have bottomed out. The management team has communicated that the last three months (November, December 2025 and January 2026) have all printed double digit YoY volume growth
Final thoughts on Operating leverage
Operating leverage is one of our favourite themes in the market right now. If the Indian economy is indeed getting back to the growth path in the broader markets (credit growth has risen to ~14% by end of December 2025), it makes all the more sense to focus on operating leverage to explore opportunities that can present nonlinear earnings growth.
When it comes to operating leverage, the most important thing is this — you have to be extremely choosy about where you want to play this as an investor. You simply cannot apply an operating leverage framework across every single sector. You need a very clear sector-specific view.
Start with industries where fixed assets are high and asset returns are structurally low. These automatically become strong candidates for operating leverage because of their high fixed-cost nature. Think about sectors like cement, chemicals, MDF, hotels, or even hospitals — all of these are asset-heavy businesses. The question you need to ask yourself is: Do you have the industry knowledge? Have you tracked these sectors over the last 3–4 years? Because unless you’ve built that learning curve, it becomes very difficult to take an informed call when the operating leverage cycle finally turns.
Now contrast this with asset-light sectors. Here, the source of operating leverage is completely different. Instead of fixed assets, what drives operating leverage is customer acquisition spending. Initial acquisition costs tend to be very high, while revenues and profitability are backloaded over time. Which means for the first 2–3 years, margins may remain suppressed. But once scale kicks in, the margin expansion can be sharp — sometimes even exponential — as we’ve seen in several new-age listed companies in recent years. If this is your preferred hunting ground, your operating leverage framework needs to be adjusted accordingly.
Then comes the consumer sector — which typically isn’t an obvious operating leverage play. But here, operating leverage can emerge from unexpected sources. It can come from lower A&P spends, optimized below-the-line distribution costs, or even channel strategy shifts. For instance, a move from an MBO-led distribution model to an EBO strategy — especially under a company-owned, company-operated format — involves taking upfront costs but enables significantly higher asset turns over time. In consumer businesses, operating leverage often comes through channel dynamics, rather than fixed asset intensity.
Finally, if you look at technology platforms and IT product companies, the playbook changes yet again. These businesses usually incur very high R&D investments. Sometimes, you may spend 4–5 years developing a product before it’s even commercialized. In the initial years of monetization, revenue growth may not move profitability meaningfully. But once the business crosses a certain revenue threshold, incremental costs are marginal — and a large portion of additional revenue flows straight through to PBT. That’s operating leverage in its purest form.
The key takeaway is this: be very clear about which sectors align with your circle of competence. Build a repository of industries and business models that you understand deeply — because that’s where operating leverage opportunities are most likely to reveal themselves.
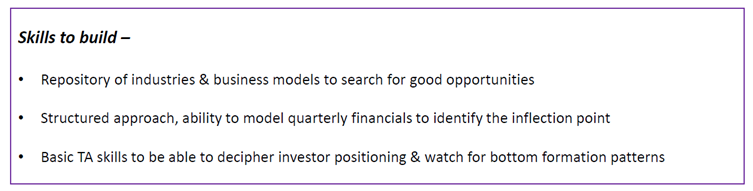
Signing off with the summary of skills investors need to build in 2026 to play the theme of operating leverage well
Conclusion: Why Operating Leverage is a Powerful Investing Theme
Operating leverage remains one of the most effective drivers of long‑term earnings growth across business cycles. By understanding how fixed costs interact with revenue growth, investors can identify companies where profits are likely to grow faster than sales.
Entering a business during a phase where profitability is temporarily suppressed due to upfront investments can offer significant upside as Operating leverage begins to manifest.
Ultimately, recognizing Operating leverage requires patience and a structured approach. Businesses that harness Operating leverage effectively can create sustainable value while delivering superior returns over time.
In the final analysis, investing—much like entrepreneurship—is non-linear. You may put in 18 months of hard work, research, and due diligence with zero returns to show for it. Then, in the 19th month, the operating leverage kicks in, the market recognizes the inflection, and your returns arrive all at once.
Our advice to the investors is to stay balanced. Do not evaluate your self-worth purely on your daily net worth or your market returns. Have “multiple irons in the fire”—other pursuits, hobbies, or businesses—that keep you grounded. This emotional stability is what allows you to hold through the “Night” so that you are there to profit when the “Day” finally arrives.
The data, backed by hard work and forensic due diligence, will eventually translate into healthy returns.
Disclosure: All three case studies covered here are part of our offerings. You may assume that there have been BUY transactions in the past 30 days. We are biased in our view on these businesses
Disclaimer: None of the examples discussed here are recommendations. We do not sell individual research reports, our BUY/SELL calls will add value only when taken as part of the overall research offerings where the recommendations are diversified across sectors and themes. Please refrain from taking positions based on isolated stocks that we discuss.