
Business Analysis - Asset Management & Wealth Management
Kedar B
SEBI registration INA200012285
June 2019
Disclaimer:
The points made here are inferences based on personal experiences, please do your due diligence before applying these to your unique investment scenario. I am a SEBI registered Investment Adviser; however this does not constitute investment advice since it is not particular to a context nor to a customer
Discolsure:
HDFC AMC is a significant holding in the external capital I manage
Credentials
Worked with wealth management firms from 2011 till 2018
Last role was with a leading Private Banking outfit as an Investment Specialist
SEBI Investment Adviser certification as an individual obtained by end of 2018 after deciding to branch out on my own
Running a boutique equity advisory practice for select customers at Bangalore from Jan 2019
Working as a Fund Manager with a Bangalore based PMS (part of the start up team) from April 2019
Here I am drawing from my experience of acquiring and managing HNI+ portfolios as a wealth manager, evaluating various investment options as an investment specialist and now a Fund Manager who is scaling an asset management business (PMS) from the scratch
Terminology & Other Basics
Asset Manager can mean Mutual Fund, Portfolio Management company (PMS), Alternative Investments Fund (AIF), Venture Capital Fund, Pension Fund, Exchange Traded Fund etc
Distributor/Adviser can mean wealth manager, advisor, intermediary who sell financial products. Typically these do not own the products they distribute, follow an open architecture and sell offerings from multiple Asset Managers
Regulatorsinvolved are SEBI, AMFI (Self regulating body for mutual funds), RBI for banks AUM means Assets Under Management, term usually used by Asset Managers AUA means Assets Under Advisory, term usually used by Distributors/Adviser
Yield on Assets expressed as % of AUM/AUA – this refers to the revenue for asset managers and wealth managers
TER means Total Expense Ratio charged by an Asset Manager for a scheme/product. This is the cost to the customer for engaging an Asset Manager to manage money. Examples being 2.2% fixed fee
1.5% fixed + 20% carry over 15% hurdle
Distributor Commission is the part of the TER that is paid out to the distributor for placing assets with an Asset Manager (works on same lines as other industries)
Investment Adviser means anyone who gets registered with SEBI as per regulations. Can make money from customer only, not from commissions paid out by Asset Managers
Advisory Fee is the fee directly paid by the customer to an adviser (% of AUM, Fixed fee etc)
PMS means a Portfolio Management Scheme per SEBI portfolio manager regulations. Minimum 25 lakh investment, offering is for HNI and above
AIF has a minimum ticket size of 1 Cr, Super HNI and above
Private Banking means high end wealth management + structured solutions like prop book lending, estate planning for select Ultra HNI families
Business Model
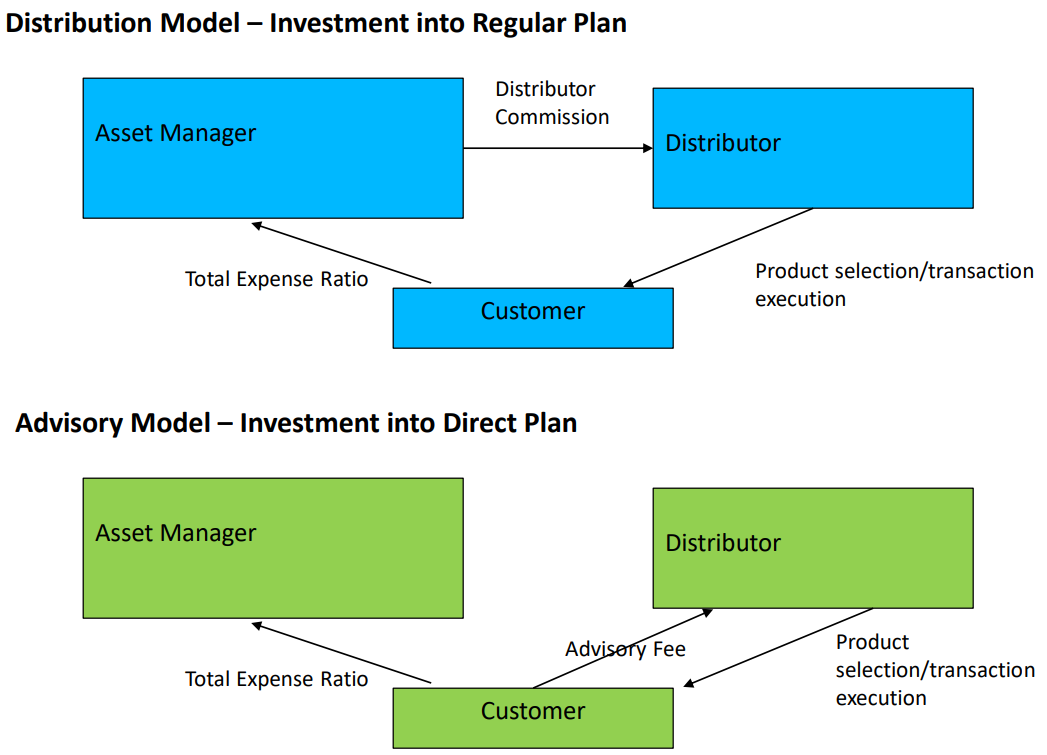
Drill Down - Asset Manager Business Model

After SEBI regulations change in Oct 2018
- Upfront commission stopped, not compensated by increased trail
- Lower TER for AMC to result in lower commission going forward as well
- Increasing Employee Costs, not easy to hire wealth managers with an existing book
- Wealth manager (employee) owns the customer, not the distribution entity
- Customers asking for reduction in advisory fee (40% fall over last 3 years)
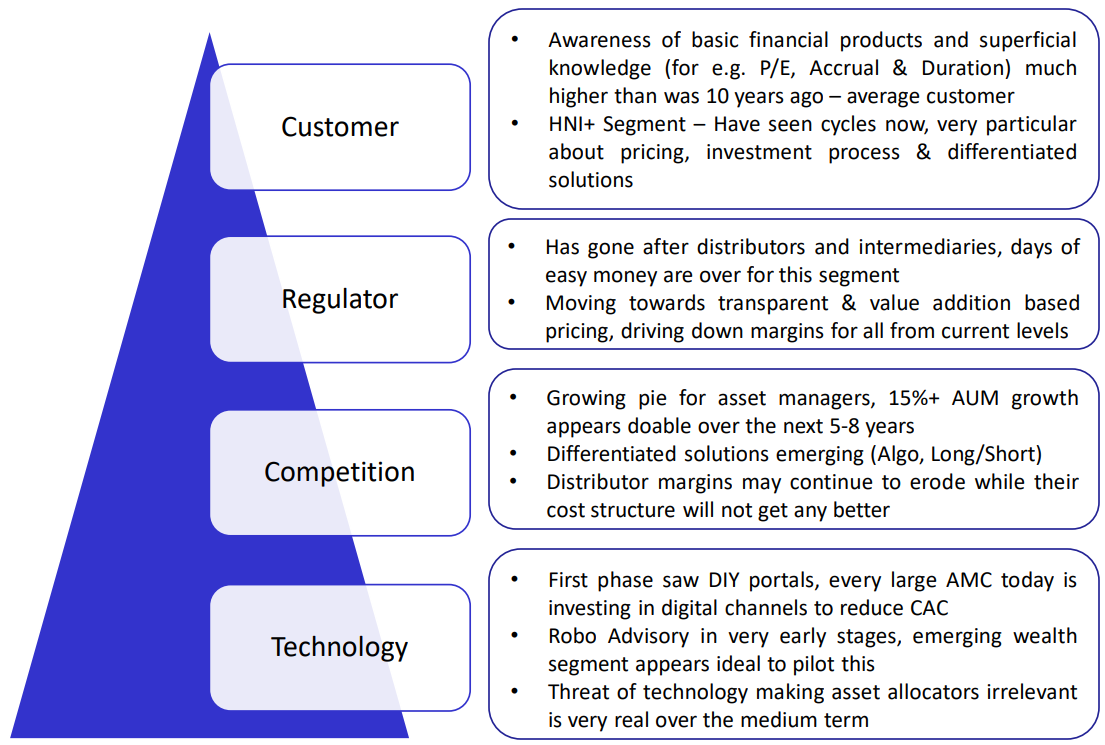
Summary of Market Forces
Some History – US Market
Phases of the US Asset Management industry
Before 1940 – Infancy, from 1940 open ended schemes started to dominate, AUM USD 450 Mn 1940 to 1970 –Post war growth period till the 1970 market collapse, AUM USD 48 Bn,
1970 till 2008 – “Investment Objective”, “diversification”, “inflation protection”. Boom of 1980 and 1990 propelled AUM to USD 4.4 Trillion by 1998 and USD 7 Trillion by 2000 During the 1990 to 2000 period, stock return outperformed real assets
Number of households investing in MF went from 23 Mn in 1990 to 50 Mn in 2000 AIF category took off, hedge funds became household discussion points for HNI+ category
2008 to date – Rise of passive investing, algo based investing also took off
1981 – IRS allows employees to contribute to 401k plans through salary deductions 1990 – 401k plans held more than USD 380 Bn in assets, 19 million participants 1996 – 401k plans held more than USD 1 Trillion, 30 million participants
Today – More than USD 4.8 Trillion in assets
Power of a system backed structured investment/savings vehicle
Where is India in the cycle – Some data points
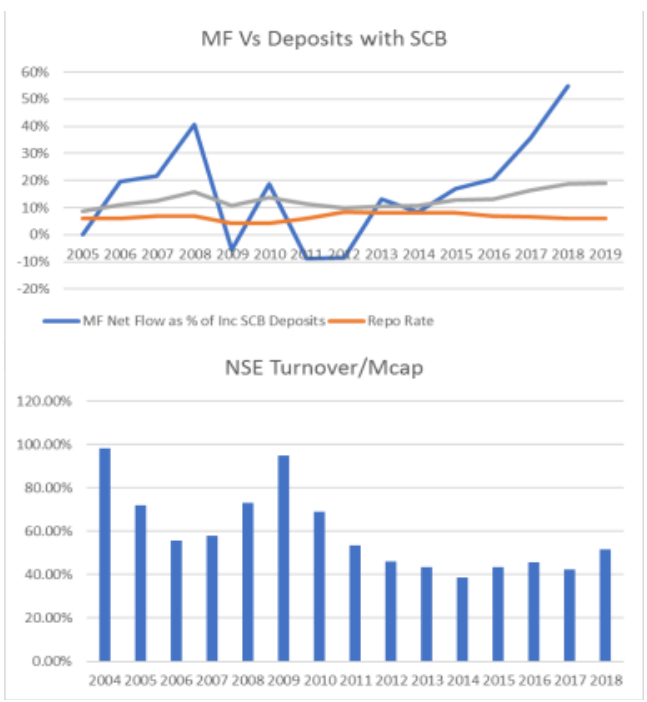
Since 2016 MF net flow as a % of Incremental Deposits has been > 20%, clear spike in the rate to 30%+ after demonetization
Lower Repo rate tends to increase inflows to MF vis a vis Deposits. If inflation stays low, this trend is very likely to continue
MF AUM typically grows at 1.3 – 1.5X the growth in deposit base (holds for the period starting from 2004 on a rolling basis)
Data Source: RBI Database
After the spike in 2009, turnover to market cap is showing a steady decrease
Possible Implications –
Exposure to equity markets becoming more structured?
Market participants are becoming more long term in nature?
Data Source: NSE
Where is India in the cycle – Some data points
Micro Segment behaviour within MF
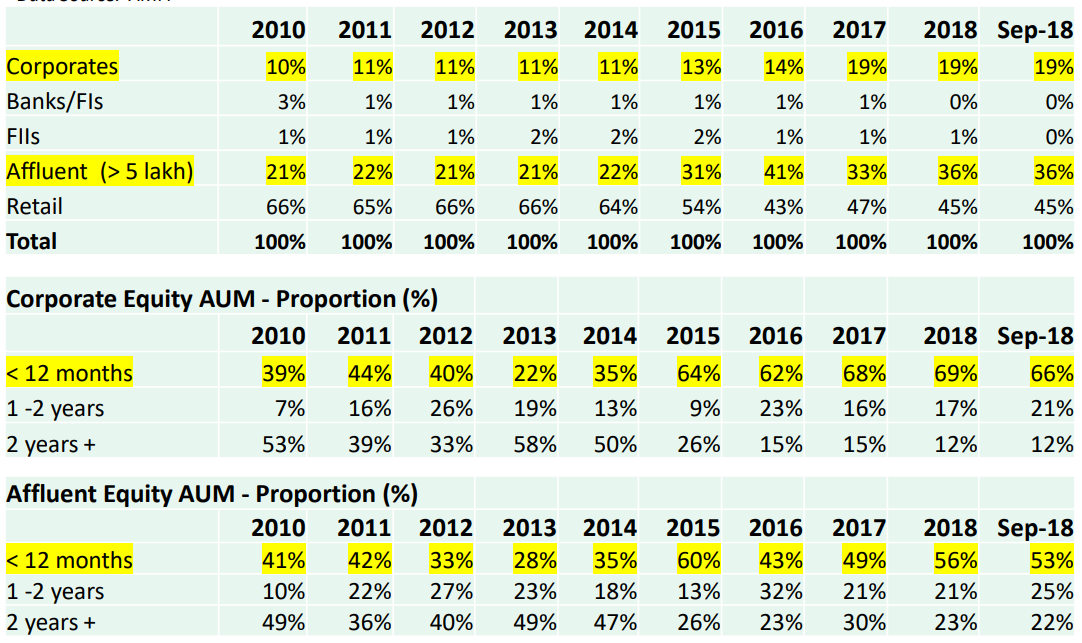
One needs to note that this does not account for the investment into PMS and AIF by HNI+ category. Once that is scoped in the trend seen above gets amplified
HNI+ is activity driven, likes to see the money and book profits once a threshold is hit
Micro Segment behaviour within MF
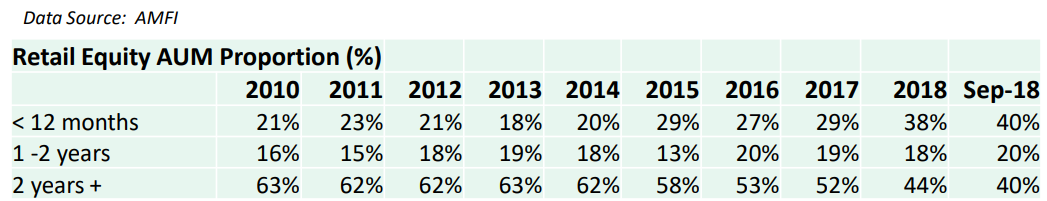
Treat Equity markets like a cold shower; Quick in & Quick out – Rothschild Family “Always Book Profits” – Indian HNI+ advised by his Wealth Manager
“Mutual Fund Sahi Hai. I will invest for the long term” – Indian Retail investor?
Trade Secret:
Wealth Managers conduct monthly portfolio reviews with their HNI+ customers
The average retail investor is usually not aware of what the return on this funds are, leave alone his overall portfolio return
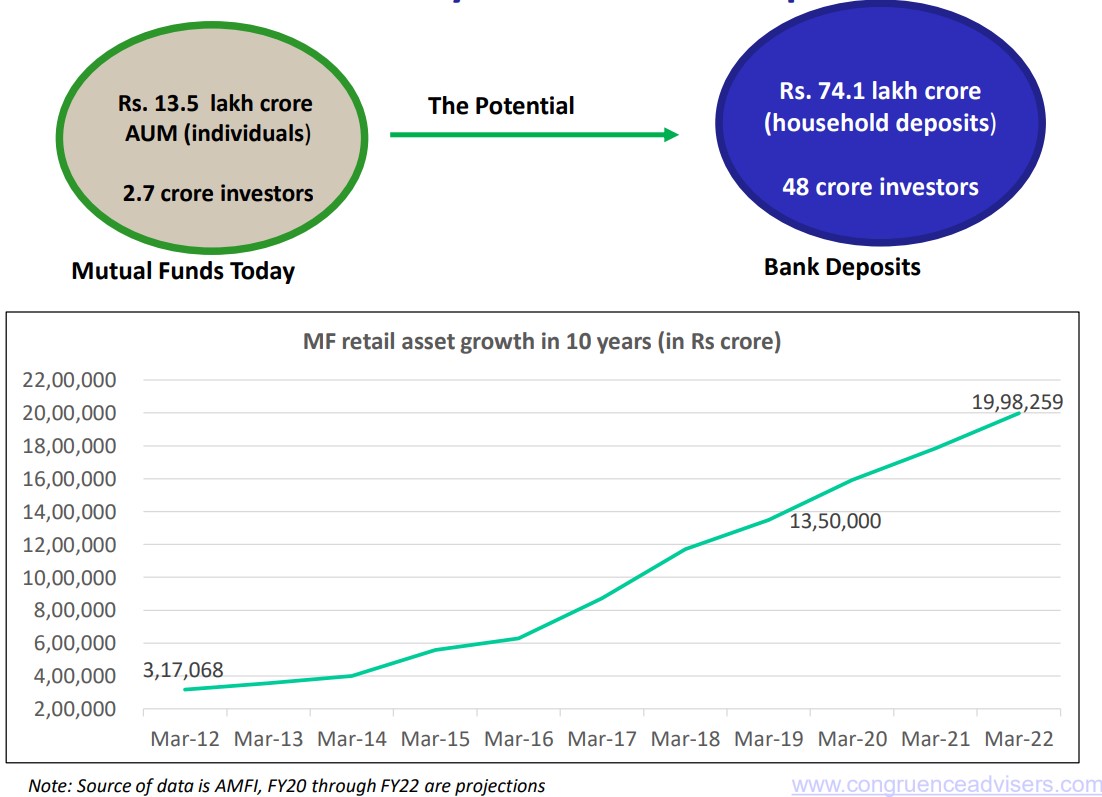
MF Industry – How cyclical is it really?
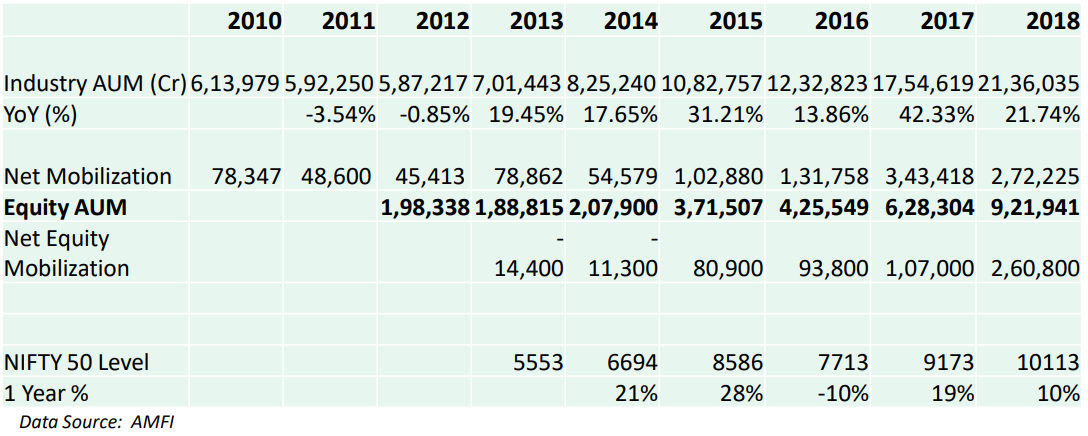
Points to Note –
- Equity AUM above takes into account new inflows, redemptions, fall in NAV due to fall in market prices during 2016 etc
- Equity AUM as of March 2019 is INR 10,44,707 Cr (growth of 15% during a bad year). Average Monthly SIP is in the range of 8,000 Cr
The steepest fall in AUM across all categories (i.e Industry level) was seen in 2009 when the overall AUM fell by 18%, this when the NIFTY fell by more than 50% in 1 year
Barring such a steep fall again, overall MF AUM will continue to rise YoY even if at a lower rate
Where is India in the cycle – Qualitative Inputs
Till 1992 – Industry very much non existent, UTI was the only player
1993 to 2008 – Lot of global players entered both Asset Management & Wealth Management business, by the end of the bull run in 2008 most of them wanted to exit. MF AUM touches 5 lakh Cr in 2008
2008 to 2014 – Period of anaemic growth, AUM moves to 8.25 lakh Cr in 2014 after languishing below 6 lakh Cr till 2012
2014 to date – Tipping point for asset management industry reached
MF becomes a pull product as opposed to a push product (customers now know) Digital push makes it very easy for anyone to invest in MF (ease of access)
PMS and AIF categories take off showing 25%+ growth (Long Short funds launched in 2016)
We are still in a phase of chasing alpha, investors aren’t yet happy extracting just beta Some time to go before we go the passive/ETF way
“If it looks like a duck, quacks like a duck and walks like a duck; most of the time it is a duck”
“I missed investing in Page Industries because I was too busy looking for the next Page Industries”
Current Investment Landscape
Some heuristics that are often quoted –
Wealth Managers are valued at 3-4% of AUA
Asset Managers are valued at 7-9% of AUM
Where do these come from?
Operational Perspective – Distributor/Advisor
First a salesman, then a capital markets professional
Value addition to customers
- Asset allocation based on customer goals
- Identify product based on this asset allocation template
- Transaction Execution
- Book keeping & Portfolio reporting giving visibility of performance at portfolio level
Value addition to Asset Managers
- Brings in AUM at minimal effort in exchange for commission
- Converts fixed cost (salary to people) to variable cost (% of AUM)
- L1 and L2 customer service – unlocks bandwidth
- Reduces selling complexity
Key BusinessInsights
- Yield on AUA is the key metric (1% in 2011, today 0.3% for 25 Cr portfolios)
- Employee Expenses (Each Wealth Manager to Cover 3X of fixed salary, bonus will be 25% of incremental revenue generated. Effectively 25-35% of revenue goes to WM)
- Share of wallet approach, customers never work with just one distributor. Thus wide range of product portfolio becomes important
- Only way for entity to lock in customers is reporting tools, technology & analytics • Minimal control over yield on AUA in current scenario
- Minimal entry barriers, access to customers is key. Since costs are mostly variable economies of scale don’t matter much, tough to build national level scale
Operational Perspective – Asset Manager
High IQ and capability driven business
Value addition to customers
- Meet return expectations for the level of risk (simple, not easy)
- Provide a stable platform where trust and security is assured
Key BusinessInsights
- Simple, predictable annuity (TER * AUM is the revenue)
- Employee Costs, compliance costs do not scale with higher AUM. Only distributor commission scales with AUM
- Incremental capital investment is close to NIL, better than some of the FMCG companies out there at no pain of inventory management!
- Once performance and brand name are in place, economies of scale can heavily favour incumbents since demand pull comes from customers
- Digital channels call for some investment but once built offer lower customer acquisition cost, higher stickiness & minimal incremental investments
- Higher the scope for absolute return, higher the TER customers are willing to pay (thumb rule will be 1% expense for 8% return, 2% for 15% and so on)
- Hence higher the equity portion of AUM, higher the potential revenue though the year to year volatility will be higher in the P&L
- Expense deducted from the AUM (no receivables, no pain to customer)
- Value growth theoretically possible at zero volume growth
Unit Economics & Yield on AUM/AUA
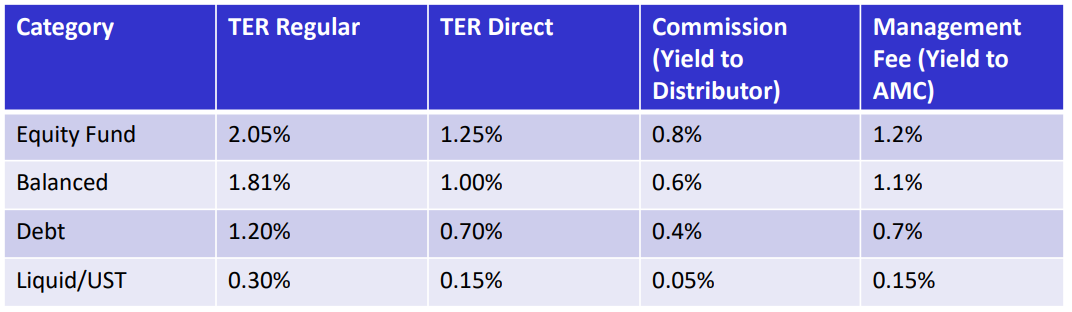
The above numbers are averages across the categories for HDFC AMC before the Oct 2018 SEBI regulations were implemented
HDFC Equity Fund
- Regular Plan – Old TER was 2.07%, new TER is 1.78%
- Direct Plan – Old TER was 1.25%, new TER is 1.27%
Increasingly the TER of Direct Plans is being increased by the AMC’s while bringing down Regular Plan TER. Direct Plans are more profitable for AMC’s since they don’t pay commissions
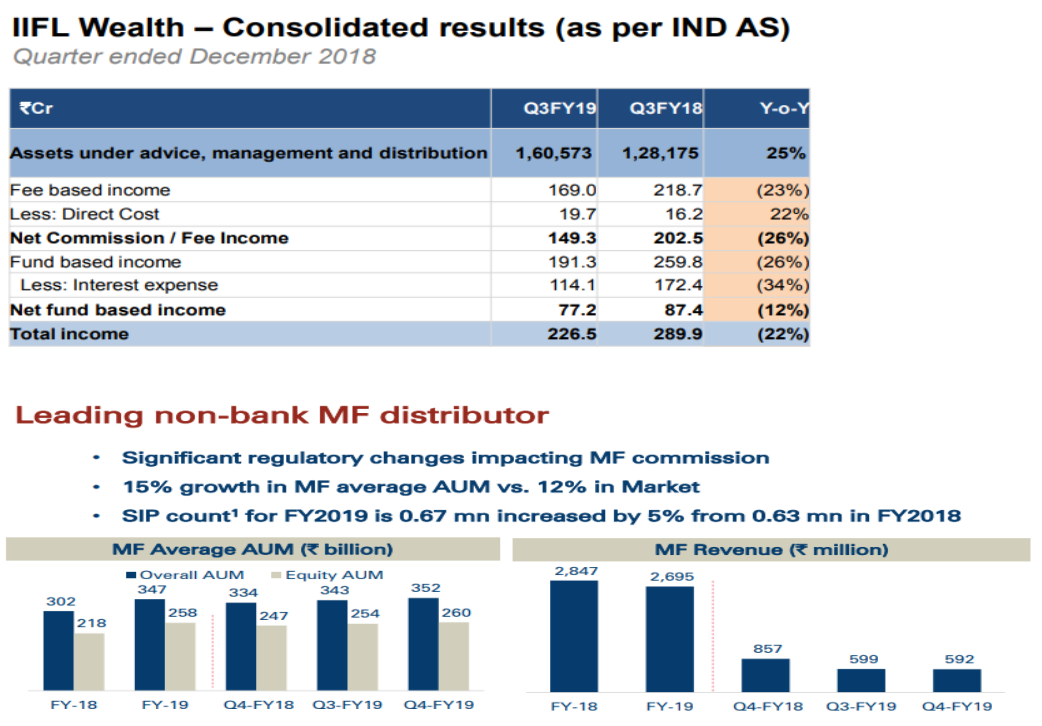
For a Wealth Manager who has 40% equity and 60% debt, blended Yield on AUA is around 0.5% on MF while they make 1.5% on alternative Assets. IIFL Wealth ran a blended Yield of 0.75% for 2018
As customers move to adviser model, blended Yield on AUA falls to 0.3%. Thus profitability of Wealth Manager gets squeezed while profitability of AMC goes up
Power Balance – Who holds the aces?
Power Balance – Who holds the aces?
Power Balance – Who holds the aces?
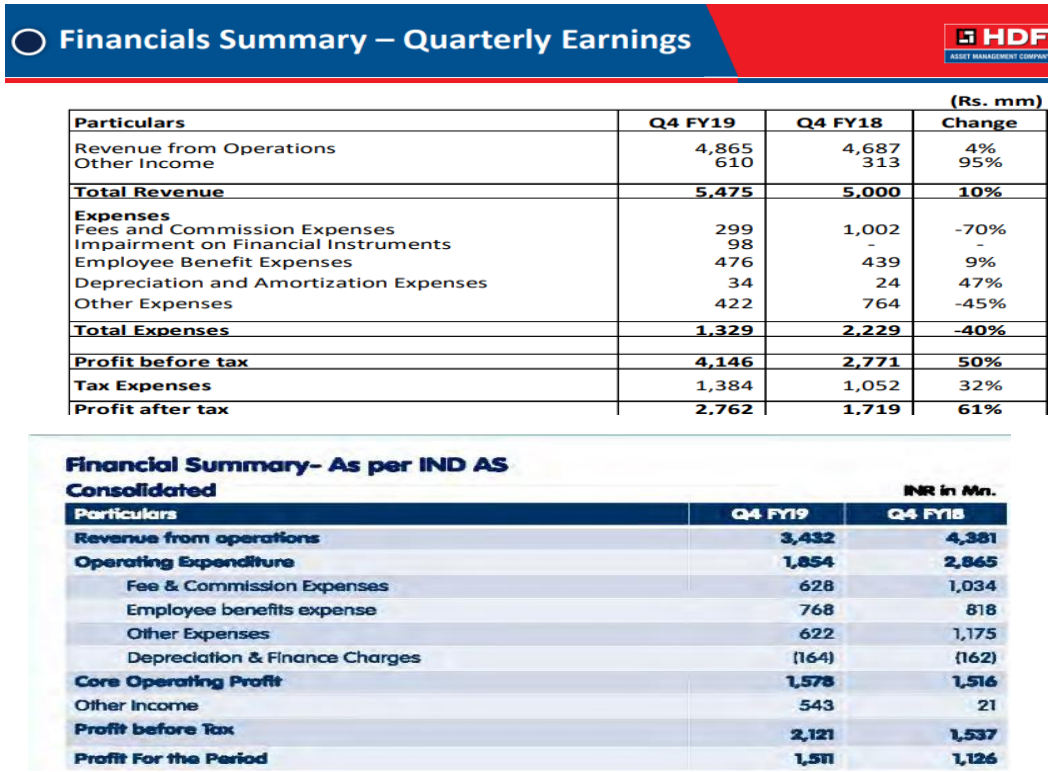
AMC’s are using the TER cuts to reduce commission pay out to distributors. Thus management fee % only falls slightly for AMC even if TER falls by 0.20%
- Under Direct Plans, as the AUM goes up AMC’s will see an increase in profitability. Most of the incremental business being sourced is through digital channels where incremental Customer Acquisition Cost is minimal
- AMC can thus make up for fall in regular plan TER by increasing direct plan TER. Very important variable they can tweak since TER in direct plans as of now is well below SEBI guidelines
- Wealth Managers have no choice but to become a price taker since customers anyway want to invest with the better known AMC’s or the best performing AMC’s
- HNI+ segment inflow to Equity may now get incrementally higher towards PMS and AIF since Wealth Managers will push those products more. This needs to be scoped into the projections one makes for an AMC
- Wealth Management companies will now focus on decreasing their Cost to Income ratio to keep profitability intact to the extent possible. Linear way of growing business by hiring more Wealth managers will no longer work
Disruption – How & Who first?
Pivot to a new philosophy of investing (Algo trading, Hybrid approach etc) – this needs to build critical mass in HNI+ before it gets democratized to retail category
- Efficient/cheaper ways of getting the same return (Indexing, ETF) – this will take off once the alpha generation tapers down. For this the point above needs to take off first and then fail over a cycle so that people see the value of low cost indexing!
- Operationally easier model of investing – this targets areas where value addition is minimal and technology can help save costs and ensure better discipline
Who? Asset allocators masquerading as knowledgeable people get taken out first by technology advisory platforms. If 20% to large cap equity, 30% to mid & small cap equity and 50% to fixed income is all there is to investment advice, technology can do it far better in the long run
When? 5+ years time frame
Technology engine becomes the advisory layer that not only monitors but also executes transactions, customer acquisition too will be dominated by technology. Super HNI will still work with Wealth Managers but for structured solutions & estate planning while the investment advisory piece will get commoditized for much lower fees
Unless wealth management firms optimize on salary structure from here, current level of margins will be tough to sustain since yield on AUA will continue to fall
What kind of investments are being made?

Impending Disruption – Summary & Key Insights
Technology driven disruption tends to first target the mass market with low hanging fruits where you have a large homogeneous customer segment
PayTM money, ET Money, Flipkart, Groww, Scripbox are all investing to capture mass & affluent segment
Ease of Investing & Participating in a growing market are the early themes that will play out Reducing expenses and Better way of Investing will follow only at a later point of time
Creating a network effect in investing is extremely difficult, this will not be a winner takes all market. There is always space for multiple players.
Robo Advisory trend in the US – Though the early movers were new players like Betterment & Wealthfront, the largest player today is Charles Schwab – an incumbent who followed these early movers and built better scale though there were 5 years late to the party
Banks & large financial institutions are unlikely to get completely disrupted, they are likely to wait and watch till the market pivots and then come in big
Disruption is more likely to collapse margins and give a better deal to customers, however it may not make incumbents completely obsolete, though it can weaken market position
Other Ground Up Insights

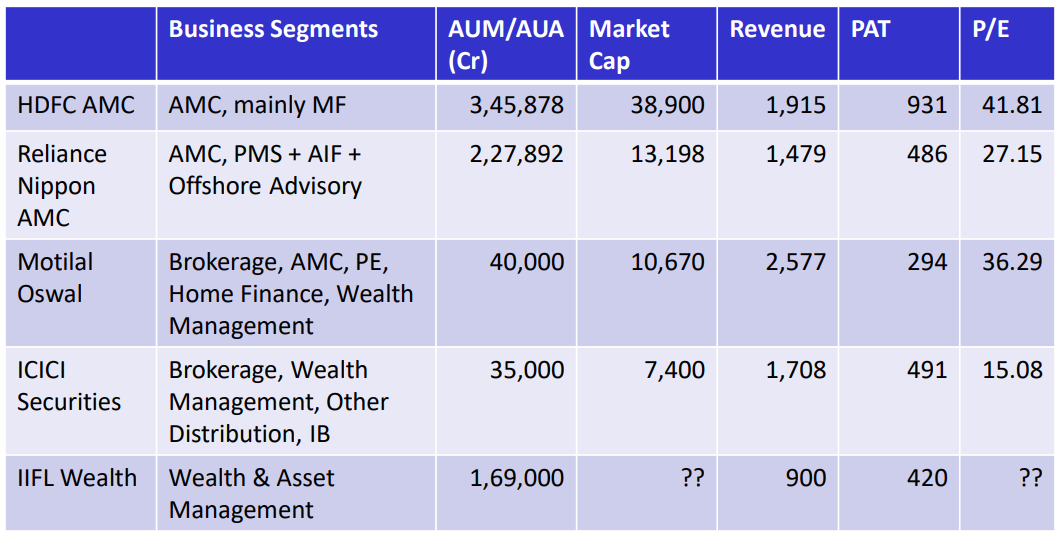
Why the Valuation difference?
Operating Leverage – As the AUM for an AMC grows, costs do not scale. Hence OPM % actually goes up (HDFC AMC OPM has gone from 48% in 2016 to 60% in 2019). The only way a traditional wealth manager can increase AUA is by hiring wealth managers with a book. Hence salary costs scale with AUA
Who owns the customer? – AMC owns the customer, in traditional wealth management the employee owns the customer. When the employee leaves, some customers follow
Starting cost – High regulatory and starting costs for an AMC, minimum for a wealth manager. Hence AMC’s will always be an oligopoly while Wealth management will always have a disaggregated industry structure. Hence there are limits to how much one player can scale
Control on Pricing – Fee charged by AMC is out of sight, in the advisory model customer has to pay wealth manager separately. Yield on AUA for Wealth managers set to fall by 40-50% over the next 5 years
The impact on terminal value is huge though both are annuity models
I would love to buy a high quality AMC at 35 TTM P/E
For a wealth manager I would pay no more than 25 TTM P/E. Let us see where IIFL Wealth trades at
Higher the equity book for an AMC, higher the profitability though the volatility also goes up
Questions/Feedback
SEBI Adviser INA200012285