Paramount Communications Ltd. is a micro-cap stock in the cable and wire sector. Paramount Communications Ltd is engaged in the manufacturing of power cables, telecom cables, railway cables and specialised cables.
We find Paramount Communications Ltd interesting due to the strong management guidance of 25-30% revenue CAGR over the next five years. The growth will be supported by huge industry tailwinds i.e. demand is likely to outstrip supply in both export and domestic markets with a debt-free balance sheet, Paramount Communications Ltd is well-positioned to outperform the market and further enhance its export contributions. We commend management for successfully executing a turnaround in the past and restoring the business to a strong growth trajectory.
Paramount Communications Ltd Company Summary
With a legacy spanning over six decades, Paramount Communications Ltd has built an extensive product portfolio, including LT and HT Power Cables, House wires, Optical Fiber Cables & other Telecom Cables, Railway Cables, Specialized Cables, Instrumentation & Data Cables, Fire Survival Cables, etc. Paramount Communications Ltd is renowned for its technologically advanced products that ensure reliability and protection.
Paramount Communications Ltd caters to various sectors including power, telecom, housing and real estate, railways, infrastructure, construction, and defense sectors. Paramount Communications Ltd also offers specialized services independently or in partnership with other renowned equipment manufacturers and construction companies in India and overseas. Paramount Communications Ltd’s extensive Pan-India network of 198 distributors, 154 dealers, and 808 retailers enables it to reach and serve a diverse customer base across India effectively.
Paramount Communications Ltd has a good foothold in the export market, with the USA serving as its largest and most prominent export destination. Its reputation in the industry and the international market is a testament to its strong focus on innovation, technical expertise, diverse product portfolio, manufacturing excellence, and unwavering commitment to delivering high-quality products to its esteemed customer base.
History and Turnaround of Paramount Communications
Paramount Communications Ltd. was a profit-making and dividend-paying company until FY08 when it substantially expanded its capacity. In August 2007, Paramount Communications Ltd. acquired AEI Cables Limited, the third-largest cable manufacturer in the UK, established in 1837.
The 2008 global economic crisis resulted in a major slowdown, impacting the Indian and UK economies. RM prices melted down significantly, and demand and pricing for end products were drastically reduced. Both the parent company Paramount Communications Ltd and the UK acquisition AEI Cables went into losses.
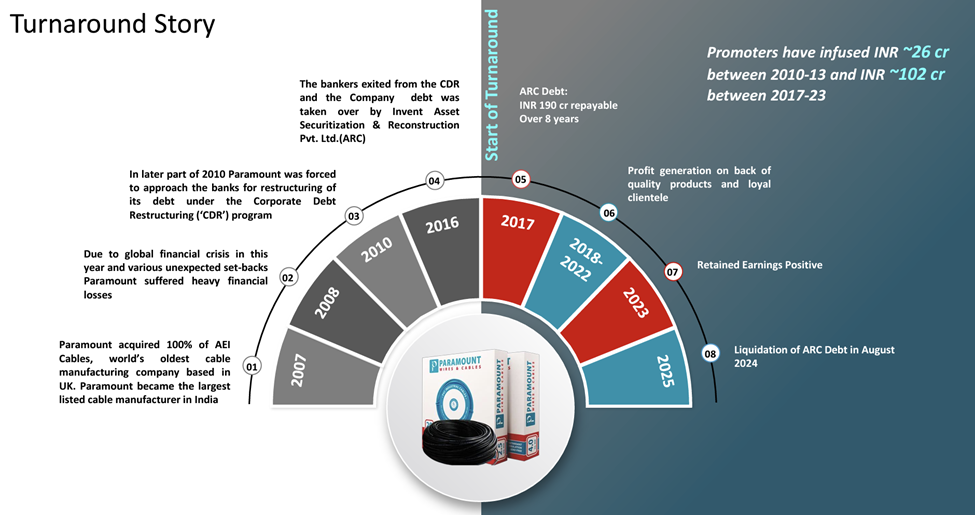
Ultimately, after six and a half years of ownership, Paramount Communications Ltd. exited the AEI Cables (UK) in 2014. Paramount Communications Ltd. suffered a long period of financial stress from FY09 to FY18 due to acquisition. During this period, promoters have infused equity capital on multiple rounds to stay float, totaling 128 Cr between 2010-2024, which includes 45 Cr infused during the last two years.
Paramount Communications Ltd. raised approximately 274 Cr from investors during the past two years through fresh equity.

On August 24, Paramount Communications Ltd. prepaid all its dues to the ARC and since then has become a debt-free company. Paramount Communications Ltd has posted strong growth numbers and profitability since its turnaround and is likely to sustain this growth trend going forward.
Paramount Communications Ltd Management Details
Mr Sanjay Aggarwal and Mr. Sandeep Aggarwal, two sons of the Late Shyam Sundar Aggarwal from the promoter family, hold key managerial positions in the firm. Mr. Sanjay Aggarwal serves as the Chairman and CEO of Paramount Communications Limited, while his brother, Mr. Sandeep Aggarwal, holds the position of Managing Director.

Paramount Communications Ltd Industry Overview
Indian consumer electrical industry
The market size of the Indian consumer electrical industry stood at INR 1,80,000 Cr as of FY23. The industry recorded a CAGR of 9-10% over FY16-FY23. Growth has been driven by a strong government focus on infrastructure development, the rising trend of nuclear families, increasing rural electrification, and a surge in cable and wire exports.
The market size of different segments of the Indian electrical industry

Wires & Cables Industry
The wires and cables (W&C) industry constitutes ~39% of the electrical industry in India. The industry offers huge growth potential and is estimated to grow at ~12%+ CAGR over the next few years, primarily driven by increased traction in the infrastructure and real estate sectors.

The cables and wires market reported an ~8% CAGR over FY14-23 to reach INR 70,000 Cr. It is estimated to clock a 12-14% CAGR over FY23-27, with the market size projected to grow to INR 1,20,000–1,30,000 Cr.
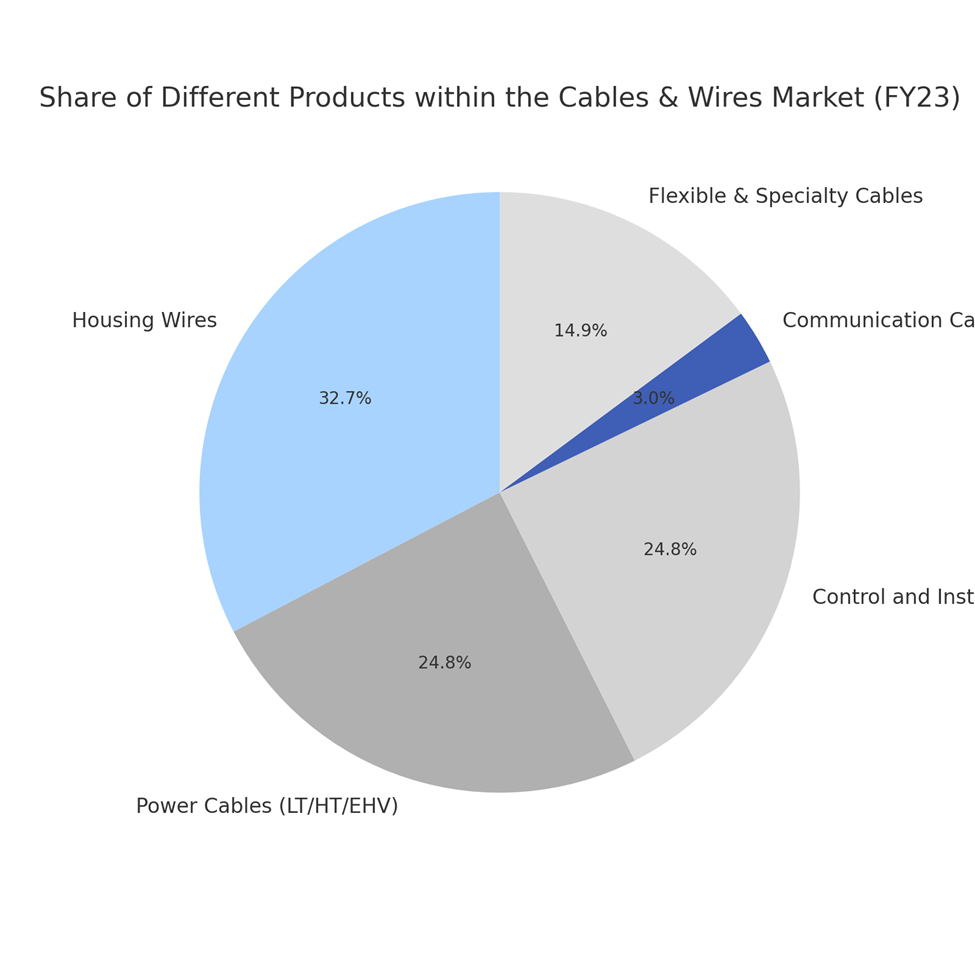
The cables & wires industry can be split into five categories
Housing wires dominate the market with a 33% share, driven by strong demand in residential construction.
Power cables and control & instrumentation cables each contribute 25%, reflecting their critical roles in industrial and infrastructure applications.
Flexible and specialty cables hold a 15% share, while communication cables have a minimal 3% share, highlighting potential growth opportunities in these segments.
Source: MOFSL, Industry
Market share of branded and unbranded players
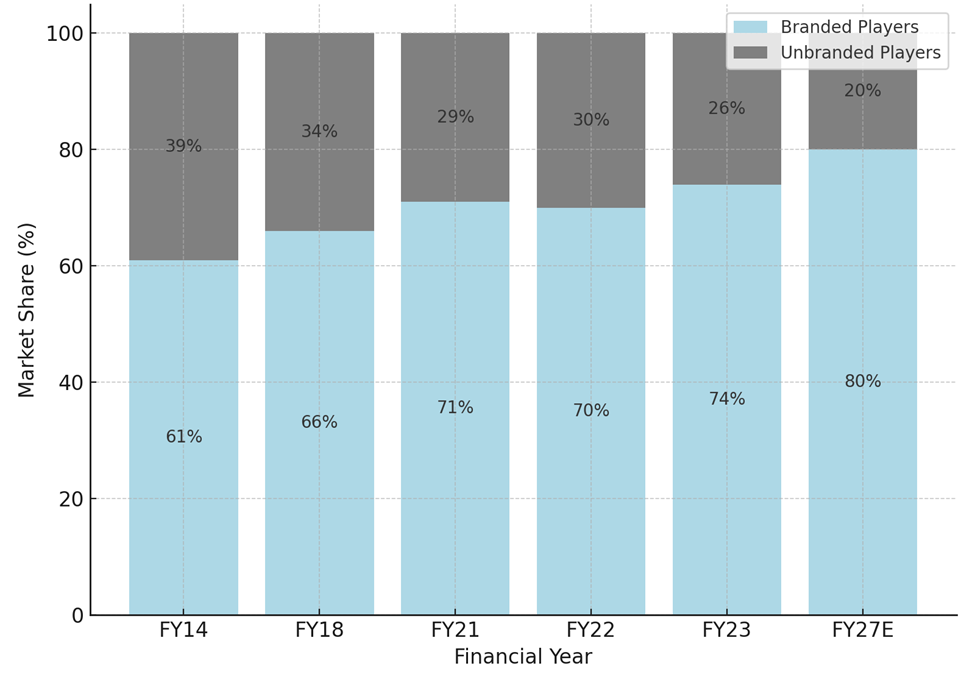
The domestic cables & wires market has steadily moved to an organized play from a largely unorganized play, including regional/national players. Branded players’ share increased from 61% in FY14 to 74% in FY23, and it is expected to improve further to 80% in FY27E.
Source: MOFSL, Industry, RR Kabel DRHP
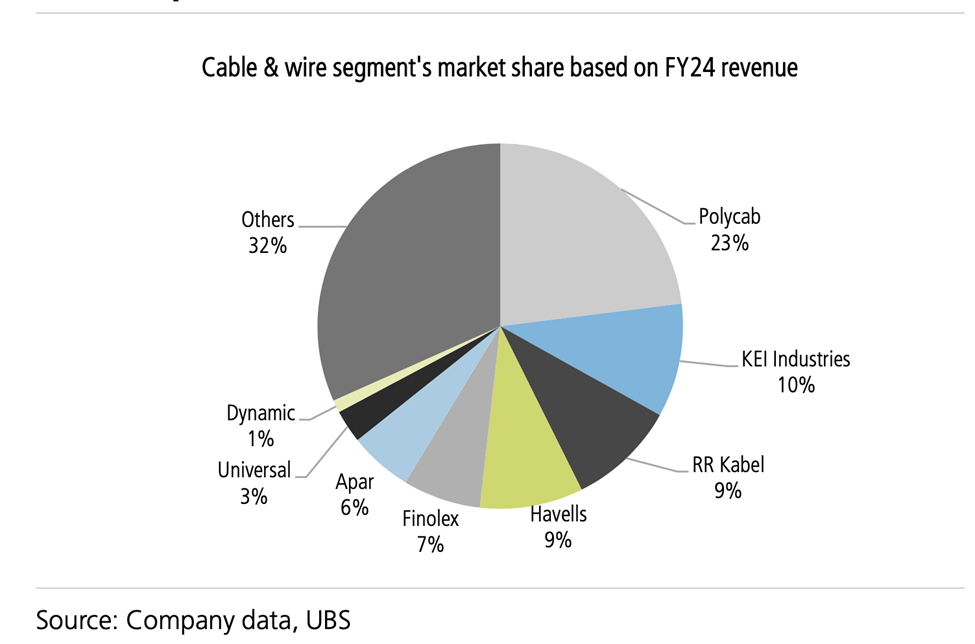
60% of the market share is taken up by Top 5 players i.e. Polycab India Ltd, KEI Industries Ltd, R R Kabel Ltd, Havells India Ltd, Finolex Cables Ltd
Raw Materials
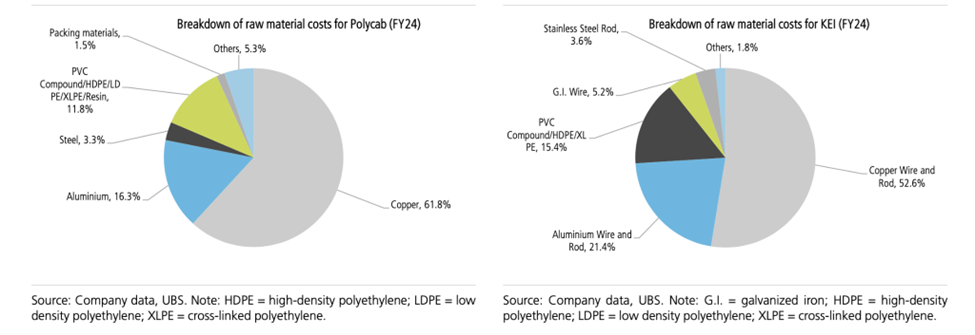
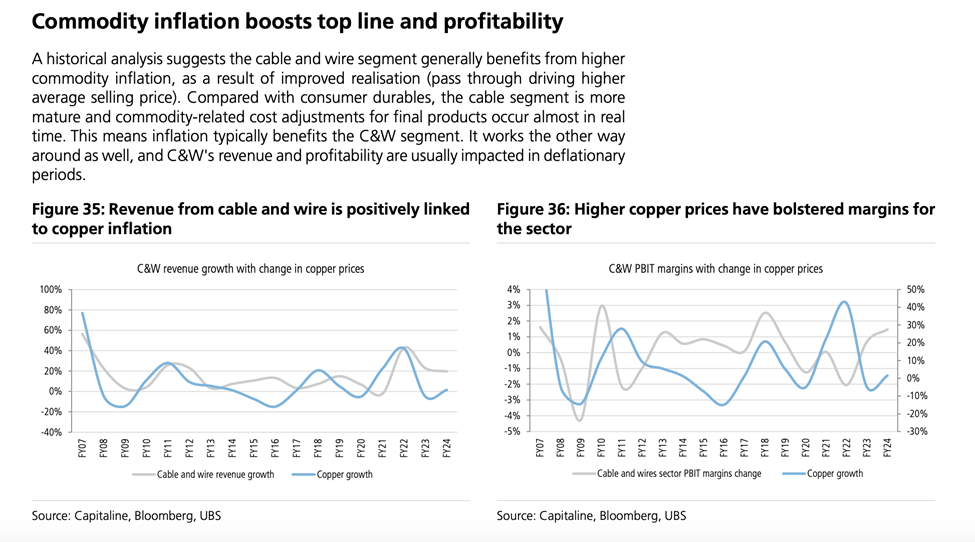
Copper and aluminum are essential materials for making cables and wires, and their prices have a big impact on production costs and profit margins. To manage this, most manufacturers work within a 90-day window from when they buy these materials. During this time, they can adjust their product prices based on changes in copper and aluminum costs. This system helps ensure that any price increases or decreases in raw materials are passed on to customers fairly.
Copper, which makes up about 55-60% of the total material costs, is the biggest factor in these price changes, making the industry highly sensitive to fluctuations. Aluminum, while less dominant, still accounts for 15-20% of the costs. Together, these two metals represent about 75-80% of the overall material expenses.
Raw Material Cost Breakdown for Polycab India Ltd and KEI Industries Ltd
Export
India’s presence in the global cable and wire market remains relatively small, with a share of less than 5% as of FY24. The global market is valued at approximately $220 billion, and India contributes only a modest portion. In contrast, China leads global trade with the highest revenue share, followed by Mexico.
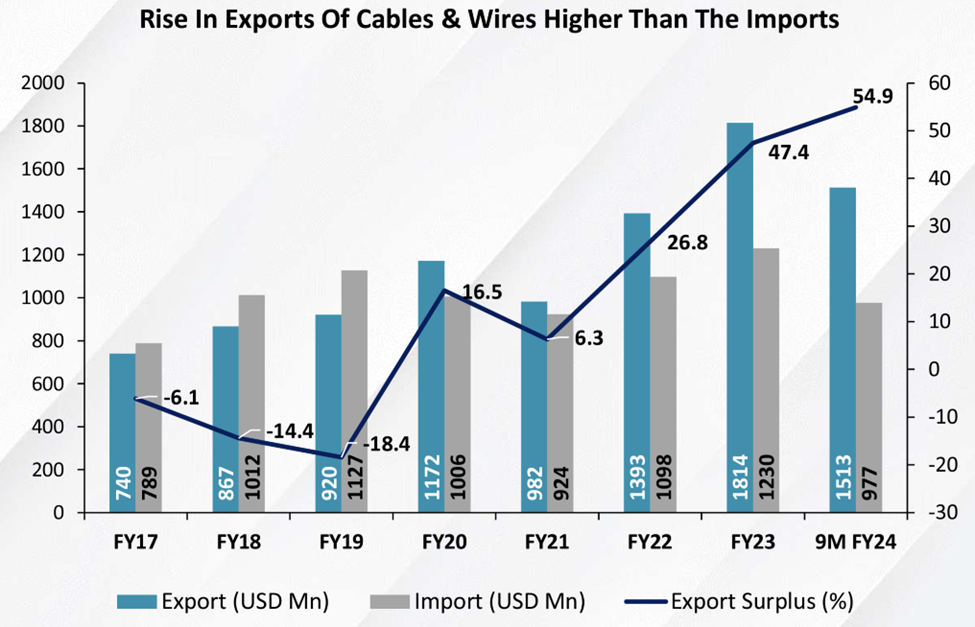
However, India is beginning to make strides in this sector, gradually increasing its market share in recent years. The momentum is expected to continue as India strengthens its position in the global cable and wire industry.
Paramount Communications Ltd Business Details
Paramount Communications Ltd Business is categorised into 2 segments – Cables and wires and Specialized Turnkey Services
Revenue Break-up by Product Segment (%)

Cables and Wires: Paramount Communications Ltd’s product portfolio offers over 25 distinct products and more than 2,500 SKUs and caters to a wide range of critical sectors such as energy, transportation, communication, infrastructure, national security, advanced research, and residential developments. Paramount Communications Ltd has successfully served over 600 institutional clients (government, PSU, B2B) and B2C segments through198 distributors, 154 dealers, 150+ channel partners, 808 retailers, and a network of 7,000+ electricians across India.
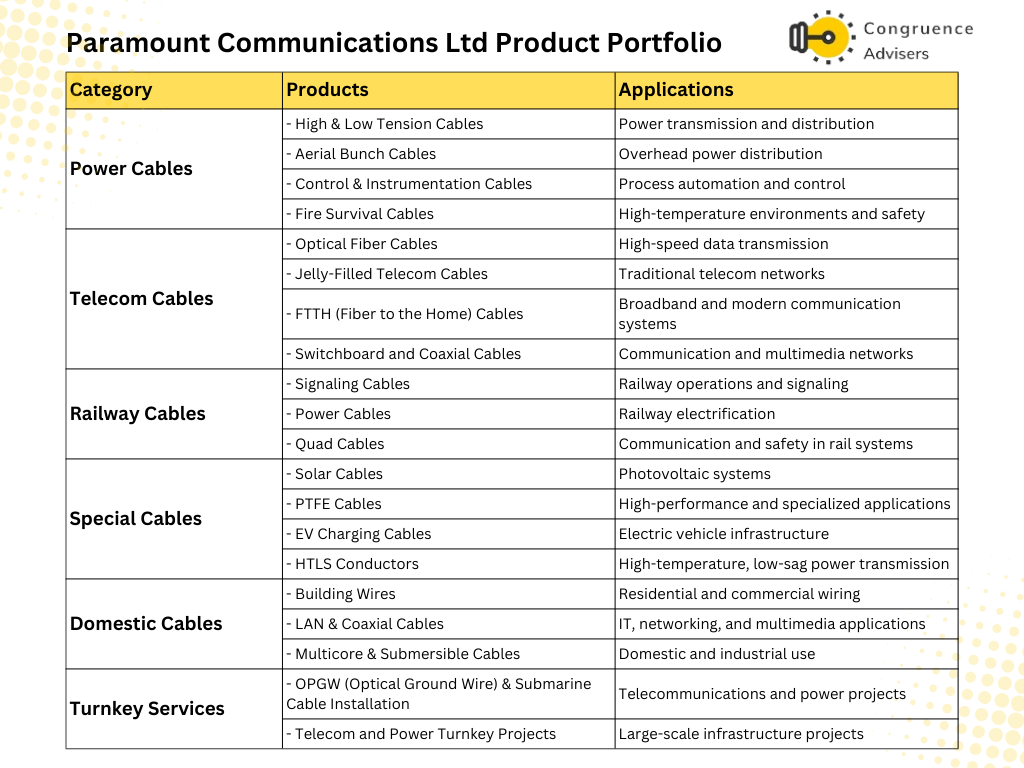
Paramount Communications Ltd. products are mainly divided into five categories: power cables, Railway cables, Telecom cables, Special cables, and Domestic wires and cables.
- Power cable – The domestic power cables segment remains a major contributor to Paramount Communications Ltd’s revenue, accounting for 41% of the total revenue. The power cable industry is expanding due to the increased adoption of renewable energy globally, capacity addition in solar and wind energy, increasing investments in the power transmission and distribution sector, and robust growth in the real estate and infrastructure sectors.
- Railway Cables – Paramount Communications Ltd continues to be one of the largest suppliers of specialized cables for the Indian Railways. The railway cables segment experienced robust growth in FY24 and contributed 15% of FY24 revenue mix. Railway Cables segment is expected to expand further due to the government’s strong focus on infrastructure development, particularly in the railway sector, and its commitment to achieve 100% railway electrification.
- Telecom Cables – Paramount Communications Ltd is a leading supplier of high-quality wiring and cabling solutions to the telecommunication sector. Telecom segment contributed 5.6% of FY24 revenue. Rapid expansion of the 5G network and the development and deployment of 6G technology are expected to fuel the growth of telecom cables.
- Domestic Wires – Paramount Communications Ltd provides a wide array of long-lasting and fire-retardant building wires for the Indian consumer market. Paramount Communications Ltd B2C sales are primarily concentrated in Rajasthan and the Delhi-NCR area, with a significant presence in neighboring northern states like Haryana, Punjab, and Gujarat.
- Specialized cables – offers specialized cables for Covered conductors MVCC, HTLS, etc, PV Solar cables, PTFE cables, Fire survival cables, and Cables for Electric Vehicle (EV) battery charging stations
Key Factors Driving Growth In The Cables & Wires Segment

Specialized Turnkey Services – Paramount Communications Ltd offers specialized Turnkey Services either independently or in partnership with other renowned equipment manufacturers and construction companies in India and overseas. Revenue contribution to FY24 revenue at 2%. The government’s emphasis on large-scale projects under turnkey and PPP models presents opportunities for major players like Paramount Communications Ltd.
Paramount Communications Ltd targets projects in the telecom and power sectors to ensure sustainable revenue streams. Furthermore, its acquisition of Valens Technologies Private Limited positions Paramount Communications Ltd to provide comprehensive turnkey services.
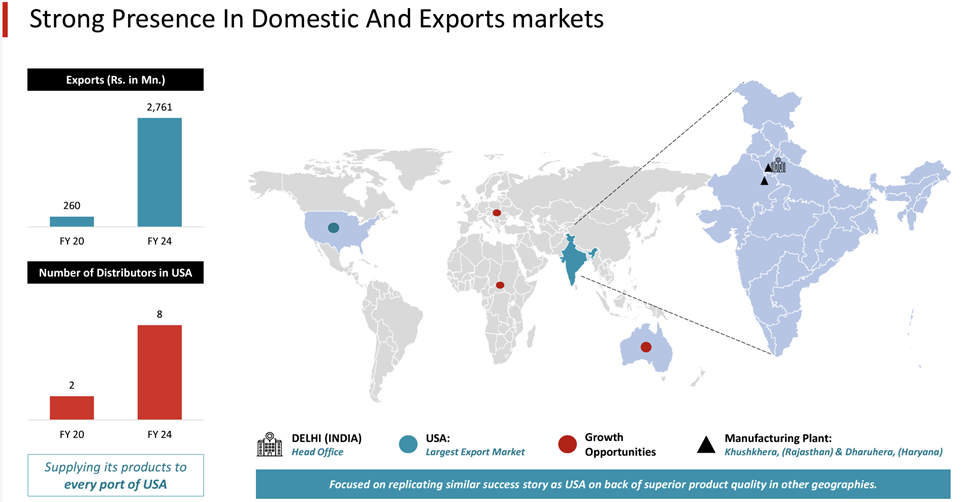
Exports – Paramount Communications Ltd exports to 25+ countries across 6 continents. Despite a global economic slowdown, its export segment remained resilient, contributing 26.4% to its total revenue in FY24. Paramount Communications Ltd’s emphasis on quality, expanding its customer base, and market reach has led to the acquisition of marquee clients across diverse international markets. Its largest export market is the USA (primarily in the B2C category through distributors), where the number of distributors expanded from 2 in FY20 to 8 in FY24. Export revenue grew at 97% CAGR over FY21-24
Paramount Communications Ltd Clients
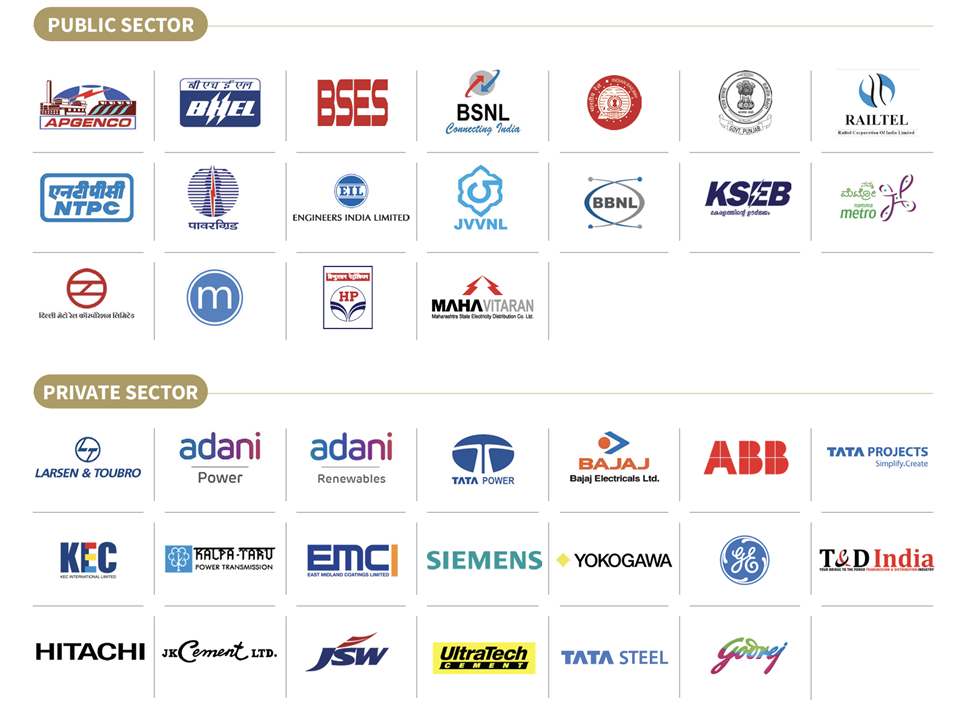
Over the years, Paramount Communications Ltd has established itself as a respected player with a pan India presence in the wires and cables sector. It has a market position across India in the B2B segment. Their clients include well-known businesses across the Public sector and private sector, such as Railtel, BSNL, BHEL, Adani Power, TATA Power, and Bajaj.
Paramount Communications Ltd Manufacturing Facilities
Paramount Communications Ltd has two state-of-the-art manufacturing facilities located at Khushkhera (Rajasthan) and Dharuhera (Haryana). The plants are ISO-certified, with special emphasis on health and safety at the workplace. Paramount Communications Ltd has the most prestigious approvals in cable manufacturing from globally acknowledged bodies such as UL and LPCB. Paramount Communications Ltd’s Quality Assurance and Testing Laboratories test manufactured cables stringently under all the parameters as per the requirements of relevant quality standards or the client’s specified requirements.

Paramount Communications Ltd spent 60 Cr on capex in FY24 and FY25 and expected to spend in a similar range for brownfield expansion and debottlenecking. Paramount Communications Ltd is looking at roughly 33,000 tons of metal processing capacity by FY26.
Paramount Communications Ltd Corporate governance
Board Composition – As of FY24, Paramount Communications Ltd’s board consists of 7 directors, including 5 independent directors who are not connected to the promoter family. The board members bring diverse expertise, particularly in the cables and wires industry, finance, and governance.
Promoter Remuneration – The Total remuneration paid to Paramount Communications Ltd’s promoters in FY24 was ₹4.28 Cr, which is 5% of the PAT. Remuneration witnessed an increment of 6.36% as of FY23.
Related Party Transactions – There weren’t any material related party transactions. However, the only material-related party transaction worth flagging is a loan worth ₹ 22Cr given by Paramount Communications Ltd. to Valens Technologies Private Limited, a 100% subsidiary of Paramount Communications Ltd.
Contingent Liabilities – On a consolidated basis, contingent liability amounts to 26.79 Cr higher than FY23, which is 4% of the net worth.
Dividend Policy – Paramount Communications Ltd hasn’t paid any dividends in the last 10 years. Paramount Communications Limited used the cash to bring down to debt level.
Paramount Communications Ltd Financial Performance
As discussed above, Paramount Communications Ltd suffered a long period of financial stress from FY09 right up to FY18. Things turned around post-corporate debt restructuring.
Since then Paramount Communications Ltd posted strong improvement in results every year except covid times in FY21. Revenue has grown at 27% CAGR in the last 3 years, While profitability has grown much faster, led by operating leverage, Higher export contribution (relatively high margin), and deleveraging. We expect this strong performance to continue for medium term

Paramount Communications Return ratios, Cash Conversion and Debt ratios
In H1FY25, Paramount Communications Ltd retired the entire debt and became debt-free in August 2024. While working capital days are much higher vs industry average due to the nature of business i.e higher institutional business and more export focused. CFO/EBITDA conversion has remained poor. Which Paramount Communications Ltd need to work on.
Paramount Communications Ltd Comparative Analysis
To understand Paramount Communications Ltd investment potential, we have conducted a comprehensive analysis. This analysis includes comparing Paramount Communications to its competitors (peer comparison) on various fundamental parameters and Paramount Communications Ltd share performance relative to relevant benchmark and sector indices.
Paramount Communications Ltd Peer Comparison
Key Listed peers for Paramount Communications Ltd. are Polycab India Ltd, KEI Industries Ltd, and Finolex Cables Ltd (the best cable and wire companies listed in India). All of them have very strong execution and financial track records. Havells India Ltd and RR Cable Ltd also have a strong track record
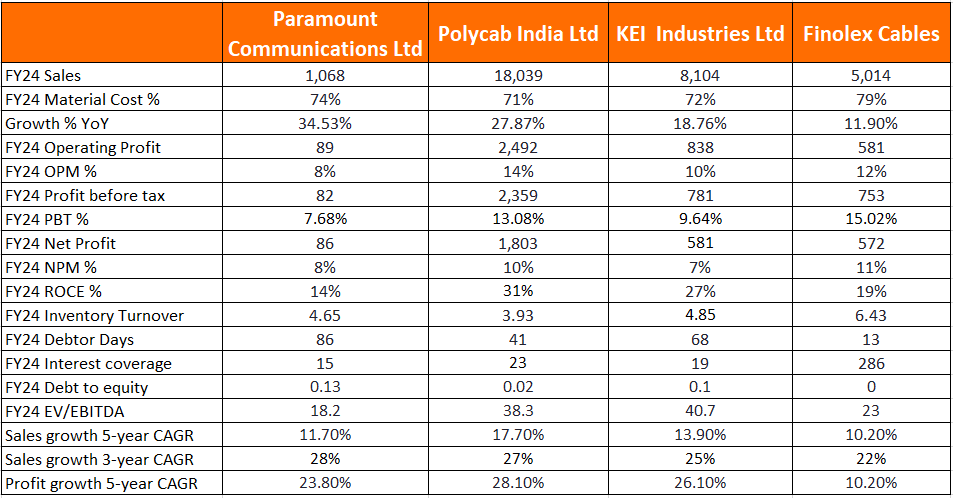
One can see baseline growth for the last three CAGRs are 22%+ for all players, supported by favorable industry tailwinds. All three companies, Polycab India Ltd, KEI Industries Ltd, and Finolex Cables Ltd, score much better overall performance and have a much higher presence in the domestic B2C segment compared to Paramount Communications Ltd.
What makes Paramount Communications Ltd. interesting is that it offers high growth rates due to its small base with a clean balance sheet. With the organization becoming debt free earlier this FY, one can expect that unit economics of the cables & wires industry to carry the business through so long as revenue growth is on expected lines. We believe that Paramount Communications Ltd can outperform the larger listed players going forward in terms of growth and stock price discovery.
Paramount Communications Ltd Index Comparison
Paramount Communication Ltd share performance vs S&P BSE Small cap Index as the index benchmark comparison is a fundamental tool for understanding the investment potential and making informed decisions in the context of the broader market
Why you should Consider Investing in Paramount Communications Ltd?
Paramount Communications Ltd offers some compelling reasons to track it closely and to consider investing if one is looking to build positions in the Wires and cables sector.
Strong growth guidance with favorable Industry – Paramount Communications Ltd Management is guiding for 25-30% sales growth over the medium term, backed by favorable industry tailwind in both domestic and exports markets
Higher contribution from export business – Paramount Communications Ltd primarily focuses on the US market (B2C in nature) for its export business due to its long-standing relationships with distributors. A large network of distributors (8-10, including Houston Wire & Cable Co. and DWC) and higher duty on Chinese cables and wires (~25%) compared to Indian cables and wires (~5%) make Paramount Communications Ltd well-placed for further expansion. Export revenue grew 97% CAGR over FY21-24. While FY24 exports were impacted due to channel destocking. As guided by management, the US market will likely contribute around 40% of total sales over the next few years. Paramount Communications Ltd is also entering new markets for exports.
Multisectoral Competencies with Strong Tailwinds – Paramount Communications Ltd serves diverse infrastructure segments, including Power, Exports, Railways, Telecom, IT & Communications, Steel, Cement, Construction, Defense, Space Research, Oil & Gas, Electronics, Renewables, and Specialized Turnkey Services. Strong sectoral tailwinds, such as increasing investments in renewable energy, rapid digital transformation, growing demand for smart infrastructure, and expanding defense and space initiatives, further bolster its growth potential across these industries.
Strong Financial Position – Paramount Communication Ltd. retired all its debt in H1FY25 and became debt-free after repaying its ARC obligations. With a much cleaner balance sheet, Paramount Communication Ltd. will gain access to traditional banking channels, enabling working capital support, reduced margin money requirements for bank guarantees, and enhanced trade financing for distributors and dealers. These improvements will support scaling the domestic B2C segment and seizing growth opportunities in the global wire and cable market.
What are the Risks of Investing in Paramount Communications Ltd?
Investors need to keep the following risks in mind if they choose to invest into this business. Risks needs to be weighed in combination with the advantages listed above to arrive at a decision that is optimal for your portfolio construct
High Competition from both organized and unorganized players – The cable industry is highly competitive, with several well-established players such as KEI Industries, Polycab India Ltd, Finolex Cables Ltd, and RR Kabel Ltd, alongside Competition from the unorganized sector. This intense competition limits pricing flexibility and weakens customers’ bargaining power. However, the unorganized sector’s presence is primarily confined to the house wires and cables segment, which contributes only about 6% to Paramount Communication Ltd’s revenue.
Raw Material Volatility Risk – Aluminum, Copper, and PVC/XLPE are the primary raw materials used in cable manufacturing, accounting for over 75-80% of raw material costs. While Paramount Communication Ltd adjusts cable prices based on raw material price fluctuations, delays in passing these costs to customers, particularly for fixed-price contracts, have previously impacted profitability.
Although most orders are short-cycle (3–4 months), Paramount Communication Ltd mitigates risk by hedging 100% of metal procurement for fixed-price contracts to reduce exposure to sharp price fluctuations. However, significant volatility in raw material prices can still moderately affect profit margins.
Higher Working capital days – Paramount Communication Ltd WC as % sales has increased to 43% in FY24 vs 36% in FY23, led by Higher receivables and inventories. Elevated receivables in early 2024 were influenced by significant sales in February-March, for which the customer credit period had not yet lapsed. Additionally, maintaining high inventory levels is necessary due to the high number of SKUs
Paramount Communication Ltd primarily sells its products through USA distributors, where it offers a credit period of 75-90 days, factoring in a shipment lead time of ~60 days. Domestic sales are predominantly B2B, with institutional clients granted a credit period of 30-90 days. To support its working capital requirements, Paramount Communication Ltd utilizes customer invoice discounting, ensuring smoother cash flow management.
Currency Fluctuation Risk – Paramount Communication Ltd derives a large part of its revenues from exports, Majorly USA, i.e. around 30%, and this is expected to increase going forward. Any adverse impact in the current can significantly impact profitability. However, Paramount Communication Ltd hedges foreign exchange exposure by booking forward contracts against export receivables.
Paramount Communications Ltd Future Outlook
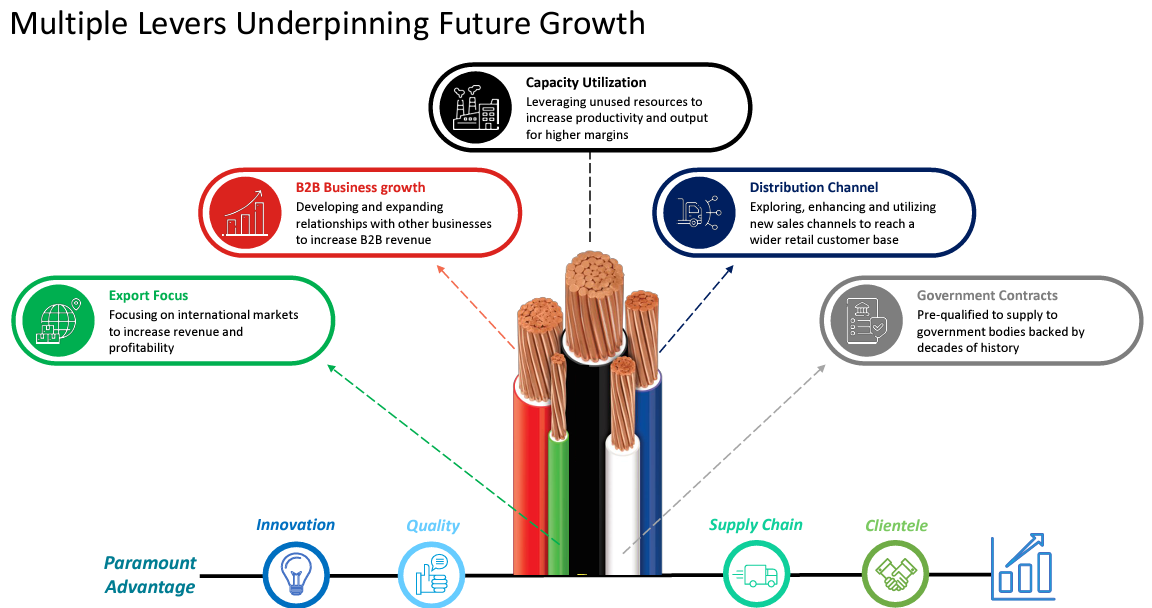
Paramount Communications Ltd Management is guiding for 25-30% CAGR over next five years. At full utilization, Paramount Communications Ltd can generate 1,800 Cr in revenue for FY26 (in line with the growth guidance) and Paramount Communications Ltd is focusing on expansion in the USA market and planning replicating similar success stories as USA in other geographies.
We believe demand is likely to outstrip supply in both domestic and exports markets over the next few years. This thesis can be verified from the Q2 FY25 earnings call of Polycab India where the management indicated that multiple players putting up capex over the next few quarters is unlikely to result in growth challenges for the industry. Achieving a growth rate of 20%+ is unlikely to be a challenge for Paramount Communications Ltd, given its small revenue base.
Paramount Communications Ltd Technical Analysis
We consider technical analysis to be a useful input in taking medium-term investment decisions. Many a time price action tends to lead to fundamental developments; this is too important an aspect to be ignored by retail investors who do not have access to management outside of common forums like investor calls & AGM.
At Congruence Advisers we like to consider both the long-term weekly chart and the daily chart to arrive at a view on price action. Combined with our understanding of fundamentals, we usually end up being better placed to be able to judge both the business cycle and the stock cycle. Playing the stock cycle right is extremely important for investors looking to extract significant alpha over the medium term.
Paramount Communications Ltd Price charts
On a Daily chart, Paramount Communication Ltd stock over the last 1 year price has been consolidating around the 65-115 price level. On Nov 23 Paramount Communication Ltd stock broke out at 65 and in January made a new all-time high of around 115. Paramount Communication Ltd stock has fallen back to the support level in April at 65 since then Paramount Communication Ltd stock has been consolidating. In September Paramount Communication Ltd stock attempted to break out on the resistance level and Again fell back to the support level and bounced back expecting a higher low at the support level and crossing above the 75 price level for more bullish confirmation.
In terms of moving averages, Paramount Communications Ltd. Stock price shows that over the last year, it has generally traded around its key moving averages, including the 50 DMA, 100 DMA, and 200 DMA. However, in recent months, it appears to have dipped below these averages during broader market corrections in August and October 2024. Currently, Paramount Communications Ltd stock price seems to be recovering and moving closer to its 50 DMA and 100 DMA levels.
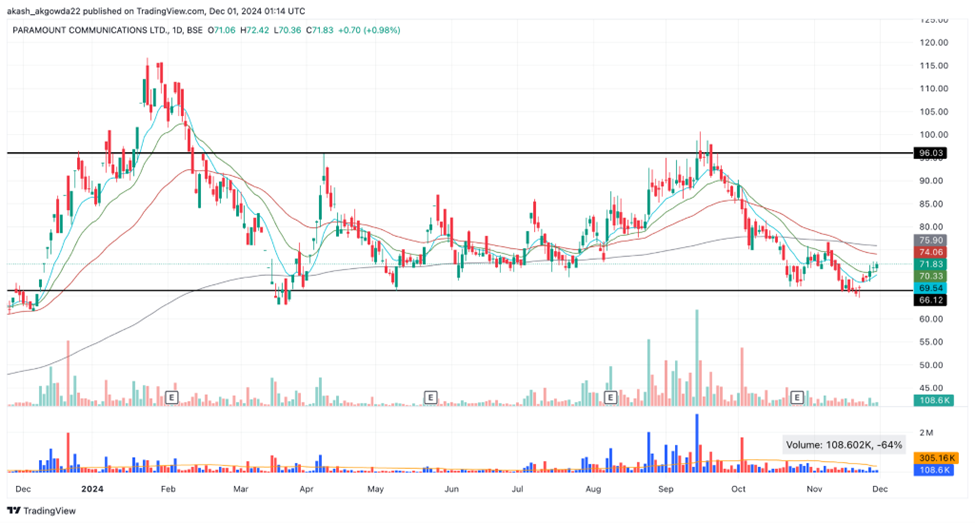
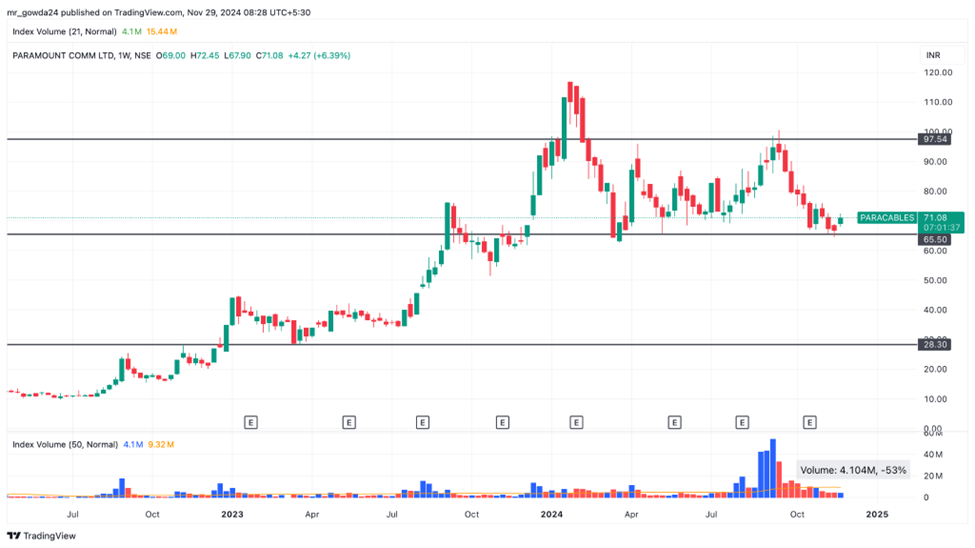
Since the significant rally beginning in mid-2023, Paramount Communications Ltd. stock has had a strong uptrend, breaking key resistance levels with increasing volumes. After peaking near the ₹115 level in Jan 2024, Paramount Communications Ltd. stock entered a consolidation phase, retracing toward the ₹66–₹76 range. Despite the correction,Paramount Communications Ltd. stock held firm above key support at ₹66 and recently bounced back with bullish momentum. The ₹96 level could act as a strong resistance in the near term, while the ₹66–₹70 range should provide a good support level for future price action.
Paramount Communications Ltd Latest Latest Result, News and Updates
Paramount Communications Ltd Quarterly results
Paramount Communication Ltd. posted strong consolidated results in Q3FY25, recording a revenue growth of 41% YoY from ₹252Cr to ₹356 Cr. EBITDA grew by 141% from ₹ 23 Cr to ₹ 33 Cr and PAT grew by 5% from ₹19 Cr to ₹20 Cr.
Paramount Communication Ltd.’s reduction in PAT% and slower PAT growth in Q2 FY25 reflect the impact of taxes, as Paramount Communication Ltd previously utilized accumulated losses for tax payments.
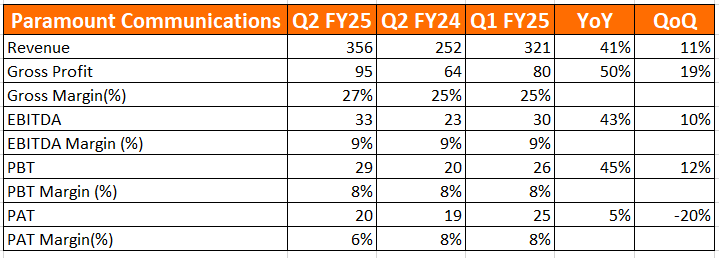
The domestic sales of wires and cables are ₹254 Cr v/s ₹184 Cr YoY, with a growth of 38%; export sales up 49% in Q2 was ₹102 Cr V/s ₹69 Cr in Q2FY24. Export sales contribution at 29% v/s 27% YoY. Paramount Communication Ltd. consumed a total of 10,757 tons of metal in this H1 FY25 vs 7,035 metric tons YoY, a 53% growth.
The pending order as of 1st of October 24 was ₹619 crores, out of which domestic cable orders were ₹427 crores & Export orders were ₹192 crores pending.
As mentioned earlier, Paramount Communications Ltd has successfully retired all its debt, making it a debt-free company. Working capital days have improved from 137 days to 109 days in H1FY25, although still higher than industry peers. Capex H1FY25 was ₹27 Cr, Expecting a similar capex range H2FY25
Final thoughts on Paramount Communications Ltd
This stock ticks many boxes –
- Operates in a sector that is favorably viewed by the investor community currently
- Healthy unit economics and capital efficiency across most players
- High base rate of success for organized businesses over the past decade
- Growth rate > 1.5x the nominal GDP growth rate of the country
- Zero debt balance sheet, further capex to be funded through internal accruals
- Reasonable valuation given the growth prospects over the next 3 years
The management has made judgement errors in the past by biting off more than the organization could digest that culminated in a stressed balance sheet. However, the P&L quality was always maintained though growth was a challenge given the lack of funds. The willingness of the promoters to put additional personal equity to keep the company afloat in the absence of bank funding should be seen as a significant positive at a time when most promoters are happily raising more equity.
We believe that 20%+ revenue growth per year is a high probability event for this business, given that both the domestic market and the export market are offering excellent traction for cables & wires players. At a PAT growth of > 20% p.a. combined with the possibility of valuation multiple rerating, investors should evaluate this business carefully and see if it can find a space in their portfolios.
Disclaimer – This note is part of a business research & analysis series on small companies, there is no BUY/SELL recommendation or target price issued as part of this. There is no assurance that this stock makes for a good investment, there is no guarantee that this stock will be included in the coverage universe of Congruence Advisers. The note contains some forward-looking statements and insights drawn from the historical results, annual reports and investor presentations; they are to be viewed only within this context and not as a prediction of future performance of the business or the stock covered.
While due care has been taken to ensure that the information here is as accurate as possible, Congruence Advisers disclaims any liability in case of any unintentional inaccuracies.
The content does not constitute investment advice.
Disclosure (Updated as of Nov 30, 2024) – Holding the stock in personal portfolio (<2% exposure as a % of the overall equity portfolio)


