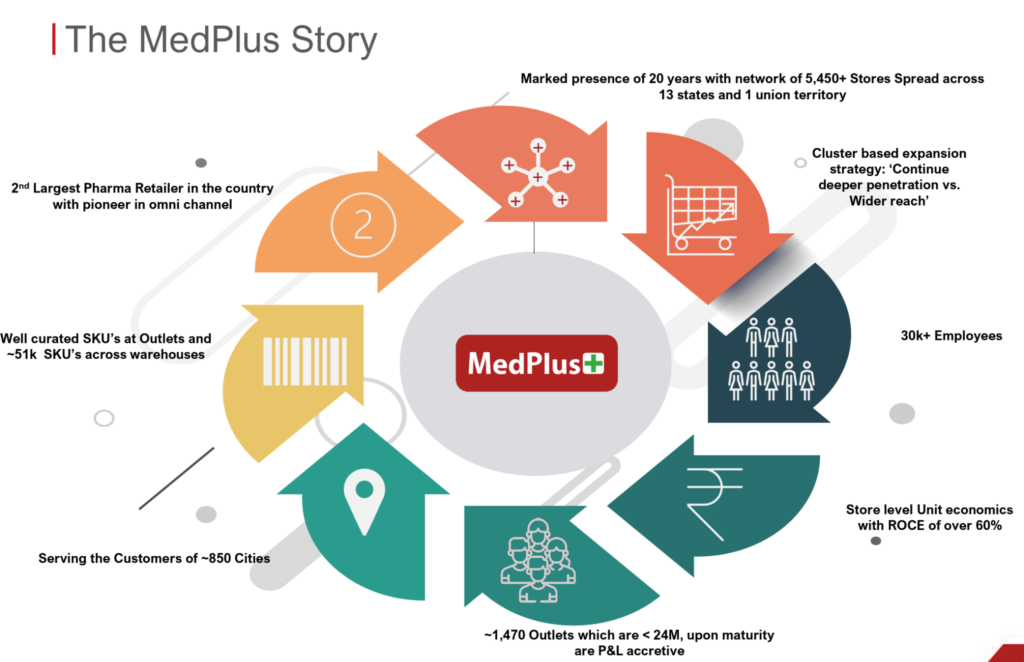
Medplus Health Services is one of the largest organized pharmacy retail chains in India. MedPlus Health Services Ltd operates 5,450+ stores in 850+ cities distributed across 13 states: Tamil Nadu, Andhra Pradesh, Telangana, Karnataka, Odisha, West Bengal, Maharashtra, Kerala, Chhattisgarh, and Madhya Pradesh. Medplus Health Services Ltd has a total of 30,000+ permanent full-time in-house employees working in a range of business activities. The business is also looking to bundle diagnostic services with its pharmacy operations and build scale in the diagnostics sector in India which has a long tail of unorganized players.
Medplus Health Services Ltd offers the opportunity to add exposure to the high growth organized pharmacy retail sector in the country that is dominated by a few players at this point of time. The top players in this sector expect to show healthy growth for the next decade through a combination of brand value, higher fill rates due to robust supply chain & logistics, better procurement efficiency and omnichannel fulfilment. The Indian Pharmaceutical market is expected to grow at ~10% p.a. with the distribution and pharmacy parts of the supply chain expected to grow at a higher rate. We believe that investors should track leading players like Medplus Health Services Ltd and Entero healthcare solutions Ltd to develop a complete view of the Indian pharma market value chain. Both of these stories may look interesting if the valuation multiples moderate from the current level to a more reasonable range, if the expected growth rate continues on expected lines.
Medplus Health Services Ltd – Company Summary
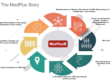
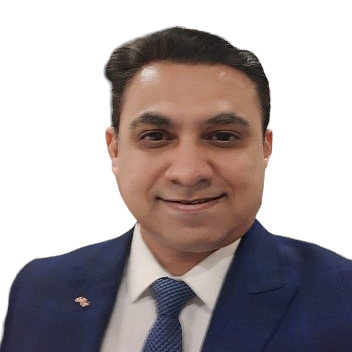
MedPlus Health Services Ltd was founded in 2006 by Gangadi Madhukar Reddy, Founder, MD, and CEO, with the vision to set up a trusted pharmacy retail brand that offers genuine medicines and delivers better value to the customer by reducing inefficiencies in the supply chain using technology. Mr. Gangadi, both a doctor and an entrepreneur, plays an instrumental role in the strategic direction and growth of our business.
MedPlus Health Services Ltd Operations include retail and wholesale sales, manufacturing and contract manufacturing of private label pharmaceutical, wellness, and FMCG products, import, distribution, and full-fledged diagnostic centers. MedPlus Health Services Ltd omni-channel platform enables it to serve customers through stores as well as its own online channels.
Medplus Health Services Ltd Management Details
MedPlus Health Services Ltd is India’s leading pharmacy retail chain, started with a single-minded focus on making healthcare delivery more customer-centric. Health Services Ltd offers a wide selection of genuine medicines at stores conveniently located in the neighborhood, stored under quality conditions, and offered at great prices.
When Dr. Madhukar Gangadi came across a WHO report indicating that up to 30% of the medicines sold in India could be fake or subpar, he decided to do something about it. He envisioned a company that would source all its medicines from reliable, big-name suppliers, store medicines in optimal conditions to ensure their efficacy, and take the risk out of buying medicines. Dr. Gangadi, a medical doctor by training and an MBA in healthcare management from the Wharton School, set up his first medical store in Hyderabad after returning from the US.
He focused on generating volumes, backend efficiency, and inventory management. The resultant cost savings were partly passed on to the customer. The first Medplus Health Services Ltd pharmacy store opened in February 2006 in Hyderabad. Today, Medplus Health Services Ltd is one of India’s leading pharmacy chains, with over 5450+ pharmacies throughout India, serving customers in ~850 Cities.
Medplus Health Services Ltd Lab is a quality laboratory with state-of-the-art testing equipment and technology. It offers the convenience of home sample pickup and low-cost report delivery.
Medplus Health Services Ltd – Industry Overview
Pharmaceutical industry supply chain in India
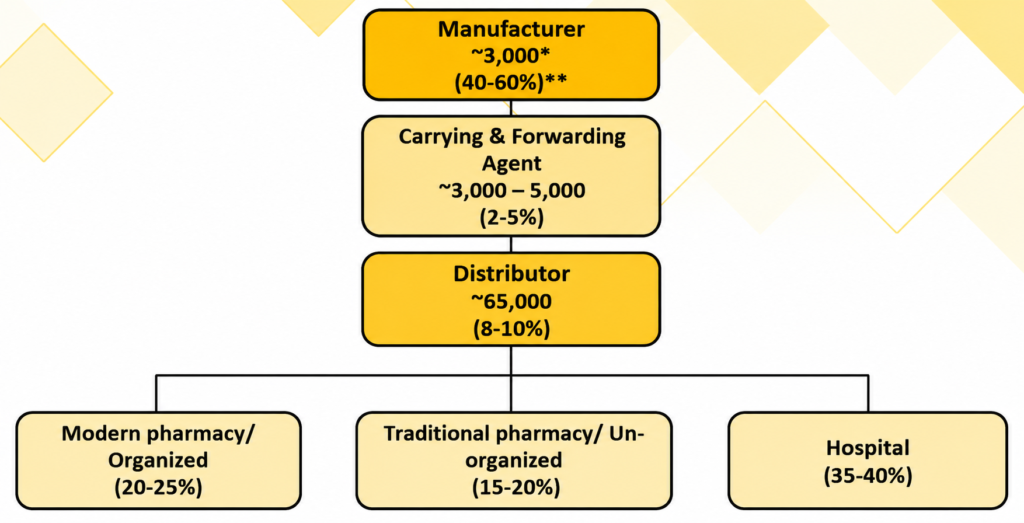
India is an integral part of the global pharmaceutical supply chain and accounts for exports and imports with more than 200 countries in the world. The pharmaceutical supply chain consists of manufacturing plants, intermediary product suppliers, logistics partners, and technology partners. The Indian domestic market consists of a large network of more than 500 medium
and large companies (that manufacture/contract manufacture), ~60,000+ distributors, and ~800,000+ pharmacy retail outlets, with more than 100,000 pharmaceutical brands available in the market given it’s a branded generics market.
Source: Medplus Health Services Ltd DHRP
The domestic pharmaceutical supply chain typically involves a company-appointed carry-forward (“C&F”) agent, responsible for handling warehousing and transportation of drugs, and supplying drugs to distributors who then provide these products to retail pharmacies and hospitals. There are multiple variations to this basic chain where a distributor may also distribute through a sub-distributor, and in other cases, an exclusive distributor may be appointed for a particular channel or customer. In some cases, manufacturers supply their products directly to retailers or through exclusive intermediaries.
Margins Dynamics – The pharmaceutical supply chain in India is highly fragmented, with margins differing significantly across each stage of the distribution network. Manufacturers typically enjoy the highest gross margins of around 40–60%, as they control the production process, pricing, and benefit from economies of scale.
C&F agents, on the other hand, operate mainly as storage and logistics partners and therefore earn relatively lower margins of around 2–4%, given their limited value addition. Distributors earn moderately higher margins of around 8–15%, as they manage inventory, regional distribution, and supply to retailers and institutions. However, they also face credit risks, working-capital requirements, and operating costs.
At the retail end, pharmacies generally earn margins of around 20–25% through direct sales to consumers. Hospitals can achieve higher retail-level margins of around 35–40%, supported by bulk procurement, stronger negotiating power, and the ability to charge for the convenience and services associated with dispensing medicines directly to patients.
Overall, margins tend to increase with the level of control over pricing, inventory, customer relationships, and value-added services across the pharmaceutical supply chain.
Retail pharmacy industry in India
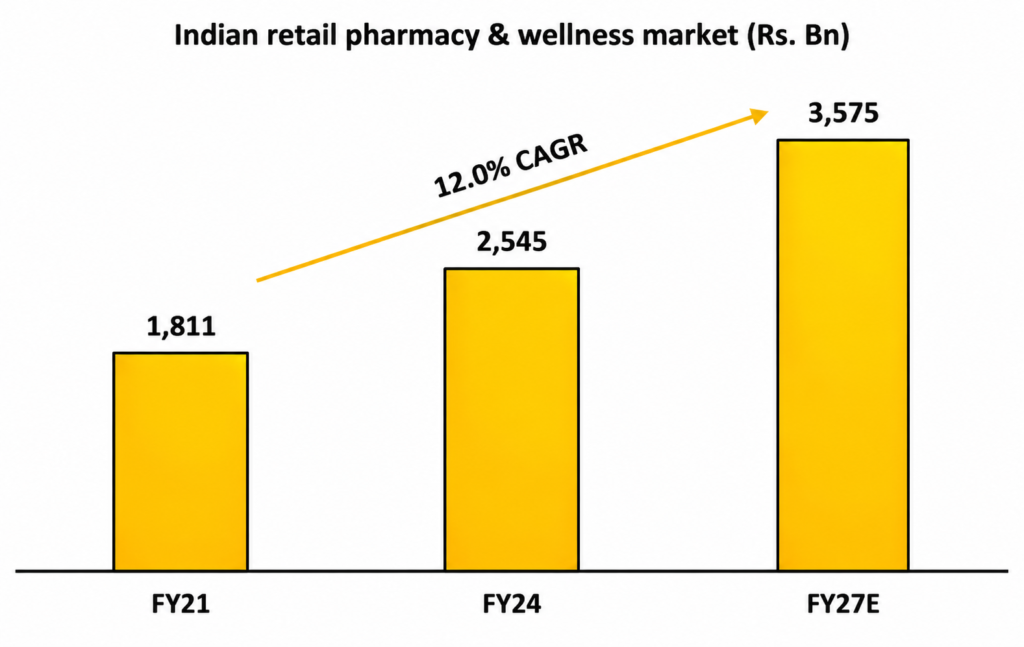
The pharmacy sector in India primarily includes pharmaceutical products such as Over-The-Counter (OTC) and prescription drugs, along with a range of FMCG items, wellness products, consumables, and medical devices. Its growth in recent years has been driven by an expanding consumer base, rising healthcare expenditure, increasing demand for OTC and prescription drugs, wellness products, private-label offerings, and the impact of the COVID-19 pandemic, which has led to a digital shift in this industry. In FY24, the retail pharmacy and wellness market in India was valued at Rs. 2,545 Bn, accounting for ~3% of the country’s overall retail market. The sector is projected to grow at a CAGR of ~12% to reach Rs. 3,575 Bn by FY27, outpacing overall retail market growth.
Source:Medplus Health Services Ltd DHRP
INTERPLAY BETWEEN PHARMACY RETAIL AND FMCG GOODS
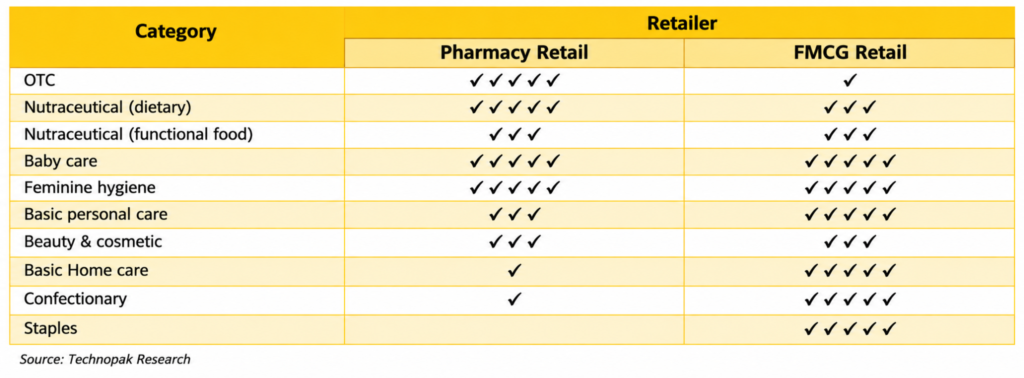
FMCG products play an important role in the overall profitability of a pharmacy retail store, with the sales contribution in a traditional standalone pharmacy store (also referred to as “unorganized retail”) in the range of 15-20%, and in the case of a modern organized pharmacy store, it can be as high as 30%.
FMCG products essentially contribute to pharmacy stores earning a higher return on capital employed and help drive customer loyalty by providing customers with a wider array of products to choose from. The major driver for the interplay between pharmacy retail and FMCG products is that they are products from adjacent categories with good margins, and that customers have the opportunity to buy essential items in a convenient manner.
The table below illustrates the category interplay between pharmacy retail and FMCG retail, with the number of tick marks (✓) indicating the suitability of the category to pharmacy/FMCG retail.
Medplus Health Services Ltd Business Overview
MedPlus Health Services Limited, commonly known as MedPlus, stands as a prominent entity in India’s retail pharmaceutical landscape. Since its inception in 2006, the company embarked on a mission to establish a retail pharmaceutical brand that not only provides authentic medicines but also enhances value for its customers through technology-driven supply chain efficiencies.
The company’s product portfolio spans across diverse categories, encompassing pharmaceuticals, wellness items, and fast-moving consumer goods (FMCG). This comprehensive range includes essential items such as medications, vitamins, medical devices, home and personal care products, toiletries, baby care essentials, soaps, detergents, as well as sanitizers, among various products.
Medplus Health Services Ltd started in 2006 with 48 stores in Hyderabad. Now, Medplus Health Services Ltd offers its services in 13 states and one union territory through 5,330+ stores, spread across Telangana, Andhra Pradesh, Karnataka, Tamil Nadu, West Bengal, Maharashtra, Orissa, Madhya Pradesh, Chhattisgarh, Kerala, Delhi, Uttar Pradesh, Haryana, and Puducherry. Medplus Health Services Ltd employs a data analytics driven cluster- based process to expand its store network.
The cluster-based approach to store network expansion is also driven by understanding
of the catchment demographics, market dynamics, and ability to support store expansion with back-end infrastructure, such as warehouses and distribution centres.
Business Segments
MedPlus Health Services Ltd, a Hyderabad-based pharmacy chain, reports its business in three segments: Retail, Diagnostics and Others.
- The Retail Segment consists of Pharmacy stores across India, and the Company has 5,330 stores (a net total of 618 stores were opened during FY2026, compared to 305 stores opened during FY2025).
- Diagnostics Segment consists of pathology and radiology services; the Company has four full-service Diagnostic Centres and eight level-2 Diagnostic Centres as of March 31, 2026.
- The other segment includes insurance broking business.
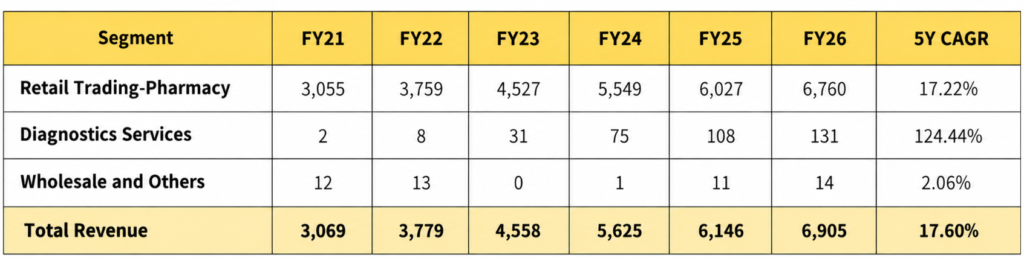
The Retail Pharmacy business is the primary operating engine of MedPlus Health Services Ltd, consistently accounting for over 98-99% of consolidated company revenues.
Cluster-Based Stores
MedPlus Health Services Ltd employs a data analytics-driven, cluster-based approach to store network expansion: first achieving high store density in a densely populated residential area within a target city, then expanding in surrounding areas within that city, followed by expansion into adjacent cities.
This cluster-based approach to store network expansion is also driven by the company’s understanding of catchment demographics and market dynamics, and its ability to support expansion with back-end infrastructure such as warehouses and distribution centers.
Capex required
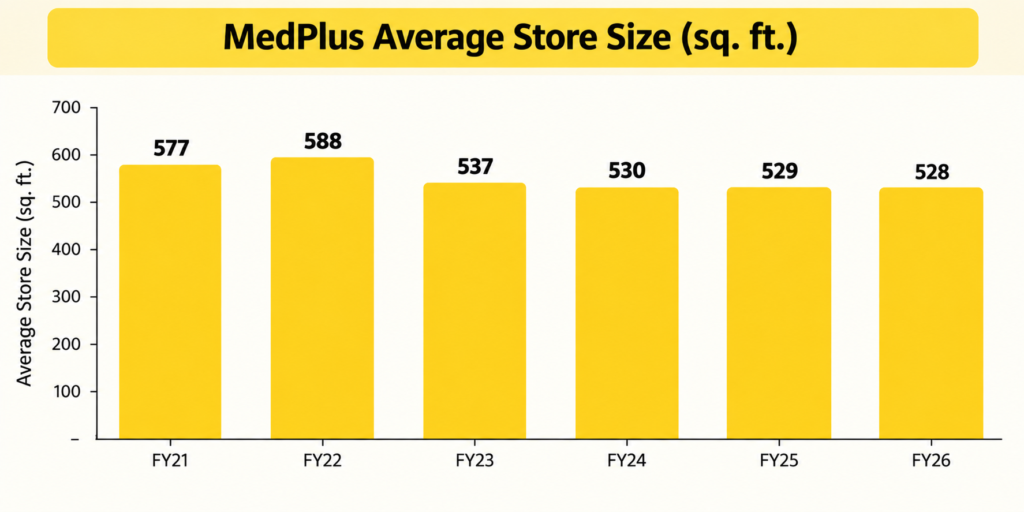
Medplus Health Services Ltd operates all its stores on a leasehold basis, with an average store size of ~528 sq ft. Of the 5450+ stores as of June 2026, nearly 73% are less than 600 sq ft, reflecting Medplus Health Services Ltd focus on compact and efficient store formats that cater to urban and semi-urban areas. Each store typically employs 3-4 personnel, ensuring optimal staffing for smooth operations and customer service.
The CAPEX required to open a single store is ~ Rs. 30 lakhs, covering lease deposits, interiors, inventory, and other setup costs.
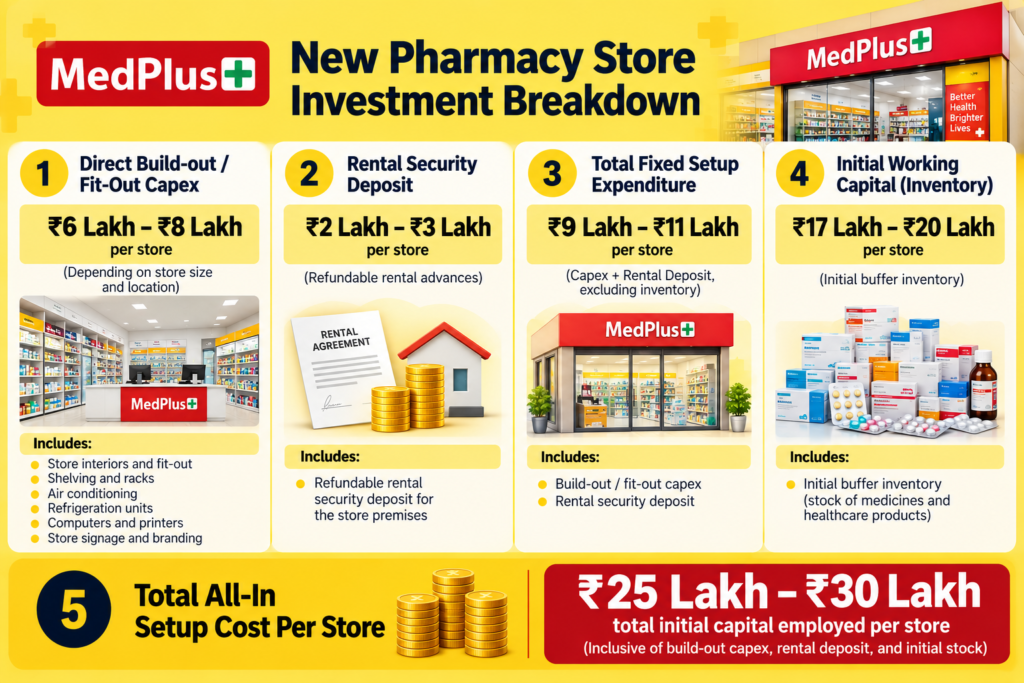
For FY27, Guidance to open 800 new stores, requiring a capital expenditure of Rs. 200 Cr. In subsequent years, it plans to maintain an annual addition of around 600-700 stores, with a corresponding capex of Rs. 150-200 cr. Historically, 2-3% of the total number of stores have been shut down/relocated annually.
The Company is modifying the format of some new stores. Whereas almost all existing stores operate on a counter-service basis, certain new ones will let customers pick up general FMCG products themselves, which should boost private label sales.
On the sourcing side, store furniture was earlier procured from Custom Furnish, a group entity founded by Medplus Health Service Ltd promoter, who remains its majority shareholder. The Company has since built an in-house furniture manufacturing facility that will supply Medplus Health Service Ltd from here on.
Franchise Model
1. Model Mechanics & Wholesale Structure
- Super-Distributor Model: Medplus Health Services Ltd operates its franchise model as a wholesale structure where Medplus Health Services Ltd acts as a super-distributor. The company sells inventory directly to the franchisee store on Day 1 as an outright sale.
- 100% Exclusive Sourcing: Franchisees are strictly required to purchase all inventory exclusively from Medplus Health Services Ltd, with no outside procurement permitted.
- Store Conversions: Beyond opening new franchise locations, Medplus Health Services Ltd selectively converts certain existing Company-Owned Company-Operated (COCO) stores to franchise outlets where local owner-operators can drive better sales performance.
- Entrepreneur Scaling: The initiative targets local micro-entrepreneurs who can efficiently operate 5 to 10 stores within their local market
2. Financials & Margin Split
- Gross Margin Distribution: In a standard pharmacy retail store, the total gross margin pool is approximately 24%. Under the franchise arrangement:
- Franchisee Share: Receives roughly 14% to 14.5% gross margin ( Medplus Health Services Ltd bills inventory to the franchisee at an equivalent discount).
- MedPlus Share: Retains 9.5% to 10% gross margin upon wholesale billing.
- Zero Store Operating Costs: Unlike company-owned stores, Medplus Health Services Ltd bears no store-level operating expenses (such as store rent, electricity, or store personnel salaries) for franchise outlets.
- EBITDA Accretion: After deducting supply chain and warehouse distribution expenses (~2.5% to 3.0%), the remaining net margin flows directly to Medplus Health Services Ltd company-level EBITDA and bottom line, making it a highly capital-efficient expansion route
3. Current Scale & FY27 Contribution
- Dominant Addition Driver: Out of 146 net store additions in Q1 FY27, 131 were franchisee stores.
- Network Footprint: Currently Medplus Health Services Ltd manages over 600+ franchise outlets across its operating states.
- FY27 Target Integration: Franchise additions form a major component of Medplus Health Services Ltd full-year target of 800 net store additions for FY27.
While Medplus Health Services Ltd had earlier phased out its franchise model due to low margins, the introduction of its new high-margin generic plan which generates higher margins has prompted a strategic reconsideration. This approach would allow Medplus Health Service Ltd to adopt an asset-light model, making it a viable strategy for entering new markets with minimal investment. Therefore, Medplus Health Services Ltd will consider the franchise model going forward.
Store Dynamics
Medplus Health Service Ltd has demonstrated remarkable expansion since its inception in 2006, growing its store network from just 48 stores in 2006 to 5,330 stores as of FY26, reflecting the Company’s sustained focus on improving accessibility and convenience for customers. The cluster-based expansion strategy has enabled Medplus Health Services Ltd to deepen its presence across existing markets while gradually expanding into new cities and towns. The pace of expansion has accelerated significantly in recent years.
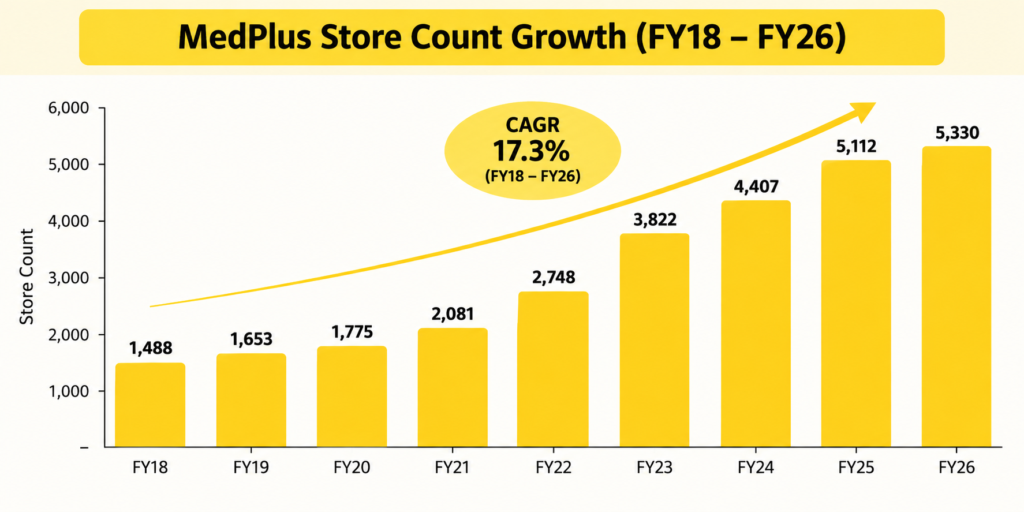
Medplus Health Services Ltd added 618 net stores during FY26, taking the store network from 4,712 stores in FY25 to 5,330 stores at the end of FY26. This translates into a ~21% CAGR in store count over FY21–FY26, highlighting the strong scaling of its retail footprint.
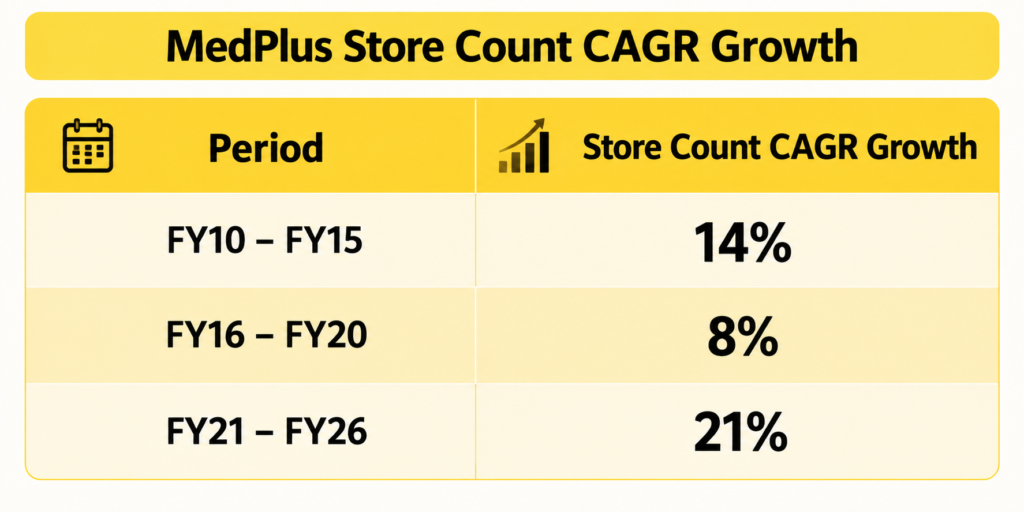
The momentum has continued into FY27, with the store network reaching 5,476 stores as of June 30, 2026, following 146 net additions in Q1FY27. Management is targeting approximately 800 net new stores during FY27, including franchisee outlets, which should further strengthen Medplus Health Services Ltd geographic reach and provide additional avenues for revenue growth.
MedPlus Health Services Ltd measures Same-Store Sales Growth (SSSG) based on stores operational for more than 12 months
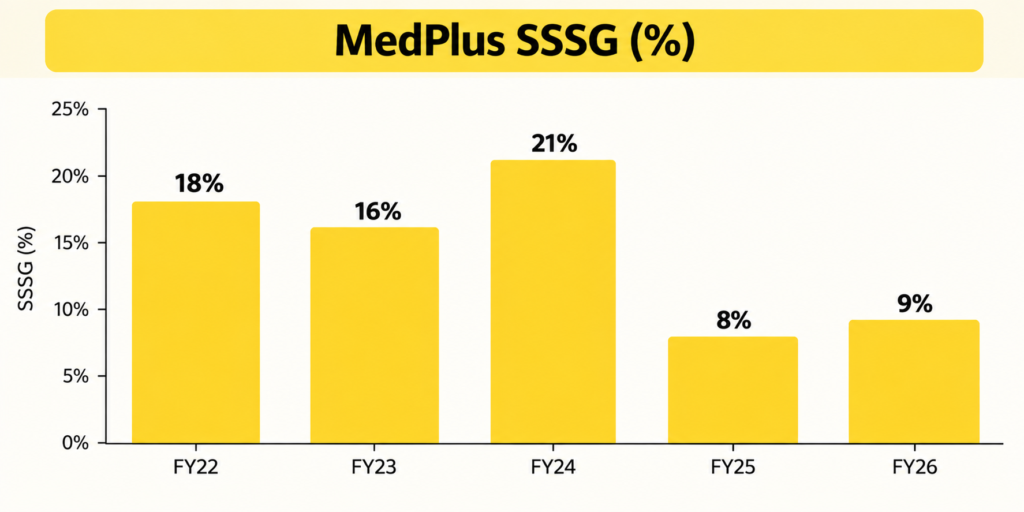
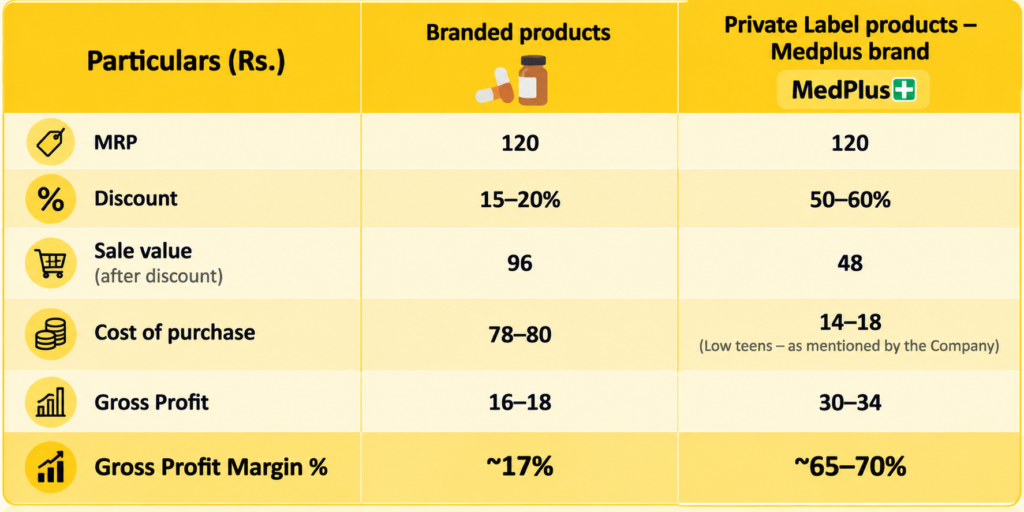
- Moderation in Late FY25 / Q1 FY26: SSSG slowed down temporarily during the middle of FY25 and Q1 FY26 due to the increasing penetration of heavily discounted Medplus Health Services Ltd store generics (offered at 50%–80% off MRP), which reduced top-line monetary realization per unit sold compared to third-party branded products, as well as temporary backend supply chain and warehouse realignment.
- Rebound in H2 FY26: SSSG re-accelerated significantly in the second half of FY26 (reaching 10.5% in Q3 FY26 and 17.8% in Q4 FY26), driven by store cohort maturation, improved fill rates from new regional warehouses, and realigned employee sales incentives across both branded and private-label products
- Target SSSG: Management aims for a normalized full-year Same-Store Sales Growth (SSSG) of 9% to 10%
Average store size
Medplus Health Services Ltd competes on affordability and convenience rather than store scale, and its outlets are therefore fairly small. Expansion into tier 2 and smaller towns has pushed the average store size lower still, since commercial spaces there are typically more compact than in metro cities.
Maturity of stores
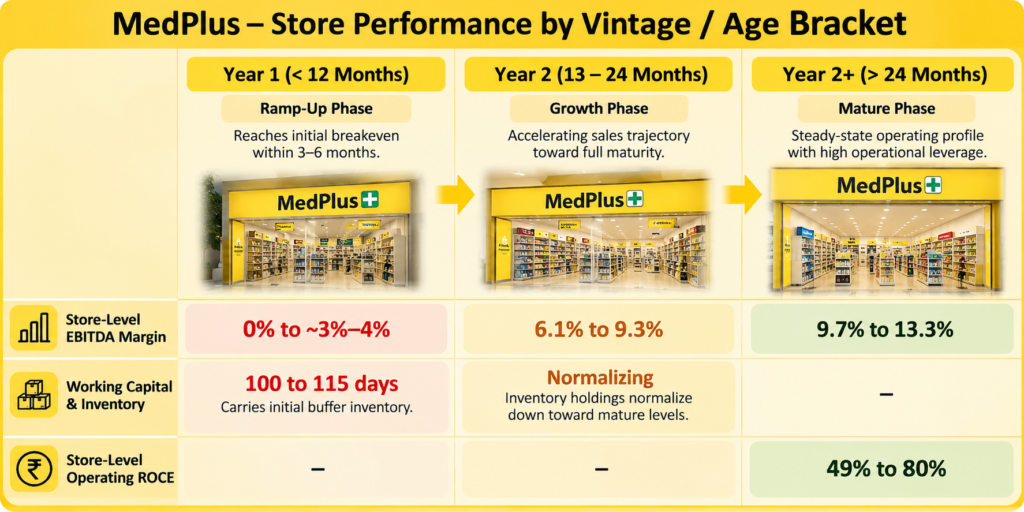
Medplus Health Services Ltd stores generally take between 24 and 30 months to fully mature, at which point they achieve a store-level Operating EBITDA margin of around 10%. Stores younger than this are still in their growth phase. Roughly 70% of these stores manage to break even within their first six months of operation. Once mature, a store typically serves approximately 11,000 to 16,000 customers per month in its area.
Medplus Health Services Ltd Product Profile
Branded Products – These are the products which are manufactured by other companies as well as sold under the brand name of another company.
Medplus Health Services Ltd sells a mix of branded pharmaceutical and FMCG products, which generate lower EBITDA margins than its higher-margin private-label products. Branded products are procured on a fully returnable basis, allowing the Company to return products upon expiry in exchange for a full refund, thereby minimizing inventory risk.
In contrast, private-label products are non-returnable, leaving Medplus Health Services Ltd to bear the full inventory and expiry risk. Consequently, while private-label products offer superior margins and remain a key strategic focus, they also entail higher inventory risk for the Company.
Medplus Health Services Ltd sources about 90% of its products directly from pharmaceutical companies’ carrying and forwarding (C&F) agents, with the remainder coming through distributors. The company is working to shift this remaining share to direct C&F sourcing as well, in order to capture the additional cost benefits.
Private Label Products – These products are also manufactured by another company but sold under the brand name of ‘Medplus’.
Medplus Health Services Ltd initially sold its private-label pharmaceutical and FMCG products under the Wynclark and MHS Pharmaceuticals brands, positioning them as substitutes when a prescribed branded drug was out of stock at the store. However, these products were priced close to their branded counterparts, which limited their appeal on affordability.
In June 2023, the company changed its approach by launching a subscription model under the Medplus Health Services Ltd brand to tap rising consumer awareness of generic medicines. For Rs 49 a year, subscribers get 50% to 80% off a curated range of MedPlus-branded products, with the average discount currently at about 60%. In Q1FY27 membership price increased from Rs 49 to Rs 149 which is expected to drive incremental topline growth of ~Rs. 10 Cr, with the benefit likely to flow through to the bottom line going forward.
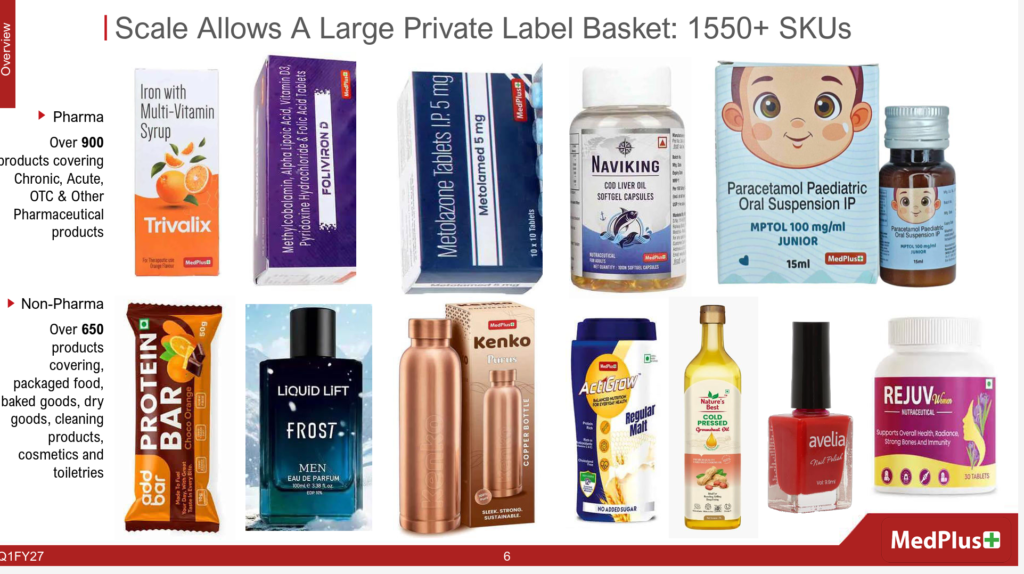
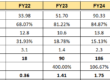
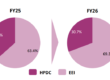
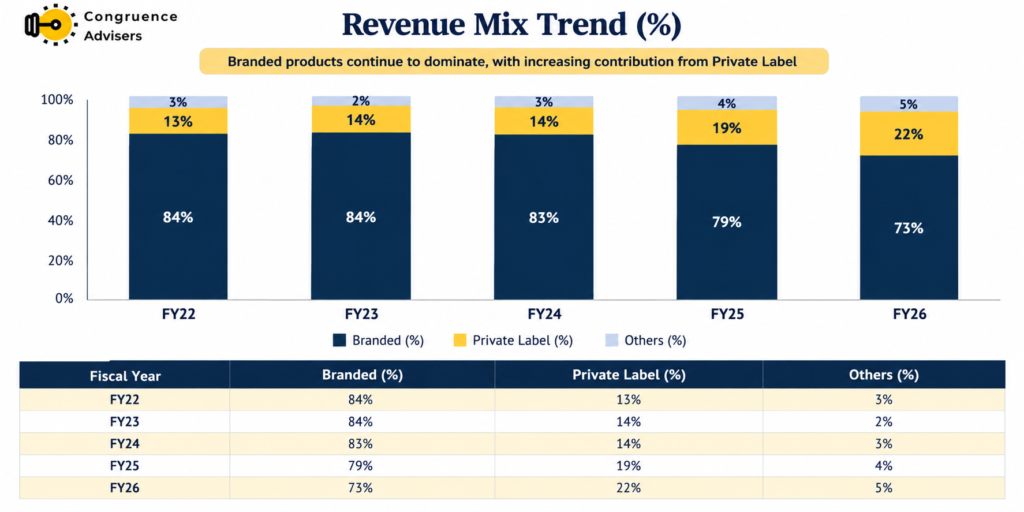
The shift supports Medplus Health Services Ltd strategy of increasing private-label penetration, since these products carry higher gross margins than branded alternatives. Although private-label inventory brings added expiry risk, the higher margins and growing acceptance of generics offer an attractive opportunity for revenue and profit growth. Currently Private labels have been an increasing trend which increased from 13% in FY22 to 22% in FY26.
Margins of Branded and Private label
Diagnostic segment
Medplus Health Services Ltd re-launched its diagnostic services segment in Hyderabad in 2023 as a pilot project with an initial investment of Rs. 110 Cr. before they had a small pathology service.
- Full-Service Centers: Integrated diagnostic hubs providing comprehensive pathology along with advanced radiology equipment, including CT and MRI scanners.
- Level 2 Centers: Diagnostic hubs equipped for pathology and intermediate radiology (such as Ultrasound, X-Ray, ECG, TMT, and PFT) without heavy CT/MRI machinery.
- Collection Centers: Distributed across neighborhood pharmacy outlets to collect pathology samples for central lab processing.
- Regional Processing Infrastructure: Medplus Health Services Ltd established its primary central processing lab in Hyderabad and has allocated capital for a new processing lab in Bangalore.
- Pharmacy-Integrated Footprint: Unlike traditional standalone diagnostic chains, Medplus Health Services Ltd houses sample collection centers directly inside its existing retail pharmacies, eliminating standalone rent and franchisee fee splits.
- Direct-to-Consumer Subscription: Through the MedPlus Advantage Plan, members receive 70% to 75% discounts off MRP on pathology and radiology tests.
- Zero Doctor-Referral Dependency: The membership model drives direct patient walk-ins and repeat visits without relying on a physician referral commission network.
Medplus Health Services Ltd Corporate Governance
Board Composition – As of FY26, Medplus Health Services Ltd Board of Directors comprised 8 members, of whom 6 were Independent Directors. Mr. Gangadi Madhukar Reddy serves as Chairman, Managing Director and CEO, and Dr. Cherukupalli Bhaskar Reddy serves as Whole-time Director.
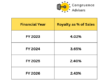
Promoter remuneration – Medplus Health Services Ltd KMP remuneration declined 12.2% YoY to ₹3.82 Cr in FY26, driven primarily by lower short-term benefits and share-based payments. Remuneration remains concentrated among Sujit Kumar Mahato and C. Bhaskar Reddy, who together accounted for ~72% of total KMP remuneration. Total KMP remuneration amounted to ~1.7% of MedPlus PAT.
Related Party Transactions – Medplus Health Services Ltd related party transactions are mainly concentrated around subsidiary Optival Health Solutions. In FY26, Medplus Health Services Ltd reported ₹713 Cr of inter-company sales, up 21% YoY, while ₹132 Cr remained receivable from Optival at year-end. This is almost the entire trade receivable balance of the standalone business.
While these transactions are eliminated at the consolidated level and management states that they are carried out on an arm’s-length basis, the size of the transactions and the high receivable concentration are worth monitoring, particularly in terms of pricing, payment terms and cash flows between the entities.
Contingent liabilities – Medplus Health Services Ltd consolidated contingent liabilities stood at ₹14.1 Cr in FY26 versus ₹13.8 Cr in FY25, primarily comprising income-tax claims of ₹11.2 crore. The total contingent liabilities amount to less than 1% of Medplus Health Services Ltd consolidated net worth as of March 2026.
Our biggest concern on Medplus Health Services from a risk management point of view has been the high promoter pledge of > 20% of the outstanding equity of the company, with the bulk of this coming from the holding of the founder. What is interesting is that pledge transactions have been regular over the past 3 years. The end usage of the pledge financing has been linked to retiring promoter debt.
What is more concerning is that promoter pledge has been steadily rising while the share price has been stagnant. The recent increase in pledge is most likely an increase of security cover since the share price has fallen over the past 12 months, this brings to the fore the primary risk that has been worrying us. When equity holding is used as collateral to raise money, falling share price can put this into a self reinforcing loop that can eventually damage the sustainability of the business itself. While we don’t accord a high probability to this negative scenario, it is something to scope into the thesis and the valuation as a prudent investor.
A detailed corporate governance check would entail looking at these additional factors, if and when we get to writing a detailed initiation note on this business
- Intangibles involved in the business, do they form a big part of the balance sheet?
- Unit economics – do they fit into the normal range for a business of this nature?
- Is accounting complicated or simple? consistent or changes every few years?
- Consistency in disclosing FX losses/gains and MTM impact?
- Consistency in tax outgo in the cash flow statement and the P&L?
- Is the promoter family actively investing outside of the business- real estate, VC Funds?
- What other organizations are the promoters and directors associated with? Any history of defaults or frauds there?
- Any history of over the top speak by promoters/management in the media?
- Analysis of audit committee notes
- History of change/retention of statutory auditors & auditor remuneration trend
- Insights from credit rating reports
- Pending litigation against company & promoters?
It has been our endeavour over the years to enhance the scope and details of the corporate governance checks we conduct. However, the entire scope of this analysis would be an overkill at this stage of business analysis. This will be appropriate for a deep dive if and when a business is considered for inclusion in the portfolio.
Medplus Health Services Ltd Financial Performance
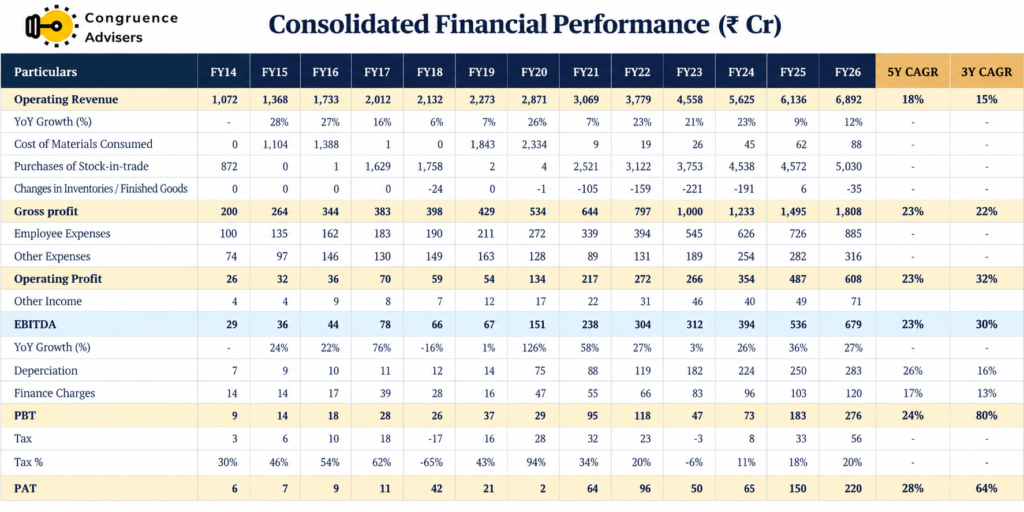
Medplus Health Services Ltd has scaled up significantly over the years, with revenue rising from ₹1,072 crore in FY14 to ₹6,892 crore in FY26 more than a 6x increase. However, the pace of growth has become less consistent in recent years. After delivering 21–23% growth for three consecutive years before FY24, revenue growth slowed to 9% in FY25 before recovering to 12% in FY26. As a result, the 3-year CAGR of 15% is now lower than the 5-year CAGR of 18%.
Profitability, on the other hand, has improved much faster than revenue. EBITDA rose from just ₹29 crore to ₹679 crore. The improvement has been particularly strong over the past three years, with EBITDA growing at a 30% CAGR versus 23% over five years.
The 3-year PAT 64% CAGR looks impressive, but it needs to be viewed in context because FY23 had an unusually low PAT of just ₹50 crore.
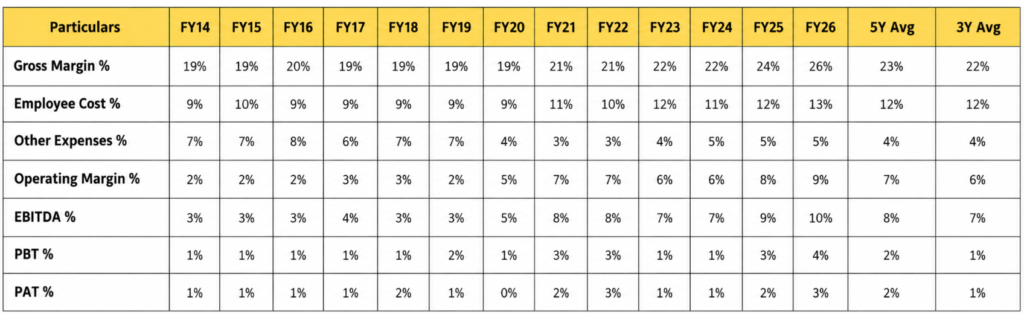
Medplus Health Services Ltd margin profile shows a clear improvement in the quality of the business over time. Gross margin, which remained around 19% for several years, has gradually increased to 26% in FY26, an improvement of roughly 7%. higher due to a combination of higher private-label penetration, a better mix of non-pharmacy products and increasing purchasing power as MedPlus Health Services Ltd has scaled its network.
Some of the improvement in gross margin has, however, been reinvested in employees. Employee costs have increased from around 9% of revenue to 13%. At the same time, other expenses have come down from around 7–8% of sales to 3–5%, indicating better operating leverage and improved utilisation of the store network.
These factors have translated into a meaningful improvement in operating profitability. Operating margin has increased from around 2–3% historically to about 9%, while EBITDA margin has expanded from roughly 3% to 10%. The improvement was particularly visible in FY20 and again during FY25–FY26.
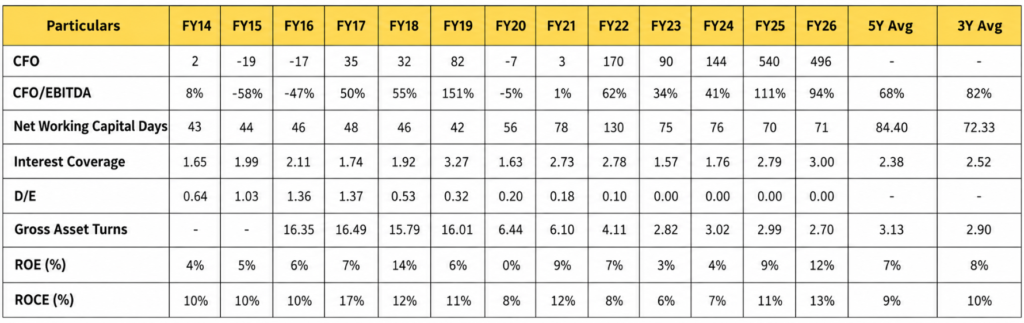
Medplus Health Services Ltd Return Ratios, Working capital, Debt, and cash flow analysis
Medplus Health Services Ltd has clearly shown a long-term improvement in cash generation, profitability and financial efficiency, though the journey has been volatile. CFO increased from a modest Rs 2 crore in FY14 to Rs 496 crore in FY26. CFO/EBITDA has improved sharply to 94% versus a 5-year average of 68% indicating much stronger earnings-to-cash conversion in recent years. However, working capital intensity remains a concern. Net working capital days increased from ~43 days in FY14 to a high of 130 days in FY22 before improving to 71 days in FY26, still above the 72-day 3-year average and indicating meaningful capital tied up in the operating cycle.
The balance sheet has strengthened significantly with D/E falling from 1.37x in FY17 to close to zero in the historical table from FY22 onwards and interest coverage improving from 1.65x in FY14 to 3.0x in FY26 providing greater comfort on debt servicing. At the same time, asset productivity has softened, with gross asset turns coming down from ~16x in FY16–FY19 to 2.7x in FY26, a function of the far larger asset base built out during the expansion phase. Importantly, returns have bounced back sharply. ROE improved from 3% in FY23 to 12% in FY26, and ROCE improved from 6% to 13%, showing that the expansion phase is translating into better returns on capital increasingly.
It is important to point out that Medplus Health Services financials get skewed due to IND AS reporting at the EBITDA level. Due to its network of retail stores that show up on the balance sheet as a Right to Use (ROU) asset and a corresponding lease liability, rent gets split into enhanced depreciation and interest expense components that has the net effect of optically increasing the EBITDA margin.
In FY26, IND AS had the net effect of overstating both the operating EBITDA and operating cash flow by 325 Cr. Adjusted for this, EBITDA falls to 355 Cr while the operating cash flow falls to 170 Cr. This has the ultimate effect of reducing the Free Cash flow to hardly 50 Cr after considering the 125 Cr capex in FY26.
For this reason, our assessment has been that Medplus Health Services needs to deliver a tangible improvement in operating margin so that store addition can happen without taking on debt. While the current level of operating cash flow is sufficient for healthy store expansion, funding both capex and working capital needs to deliver aggressive growth will need higher margin. That said, we are happy with the improvement in gross margin delivered over FY24-26 that has improved the operating cash flow of the business.However, sustainability of gross margin depends on the product mix, more importantly on the composition of private label revenue share. It is also important to note the ageing mix of stores, for mature stores deliver higher operating margin compared to stores with < 2 year vintage. While FY25 was a light year on net store additions, FY26 saw a reversion to 600+ store net addition. Higher store additions in one year will have the effect of slightly lowering the operating margin due to the higher expense base of new stores, till the time operating leverage catches up. But for a growth business that isn’t cheap, opening of stores is expected to be a continuous exercise.
Hence the trade off between new store addition (growth) and keeping margin intact is the management skill investors need to monitor over the next few quarters. Especially when valuation isn’t yet cheap in a conventional sense.
Medplus Health Services Ltd Comparative Analysis
To understand Medplus Health Services Ltd investment potential, we have conducted a comprehensive analysis. This analysis includes comparing Medplus Health Services Ltd to its competitors (peer comparison) on various fundamental parameters and To understand Medplus Health Services Ltd share performance relative to relevant benchmark and sector indices.
Medplus Health Services Ltd Peer Comparison
We benchmarked the company against three peers: Apollo Hospitals Enterprise Ltd. (AHEL), Wellness Forever Medicare Ltd. (WFML) and API Holdings Ltd., which operates PharmEasy (AHL). AHEL offers end-to-end healthcare services spanning hospitals, pharmacies and diagnostic clinics, holds the top position in retail pharmacy, and provides round-the-clock online services. WFML operates purely in retail pharmacy and is the third-largest player in the segment.
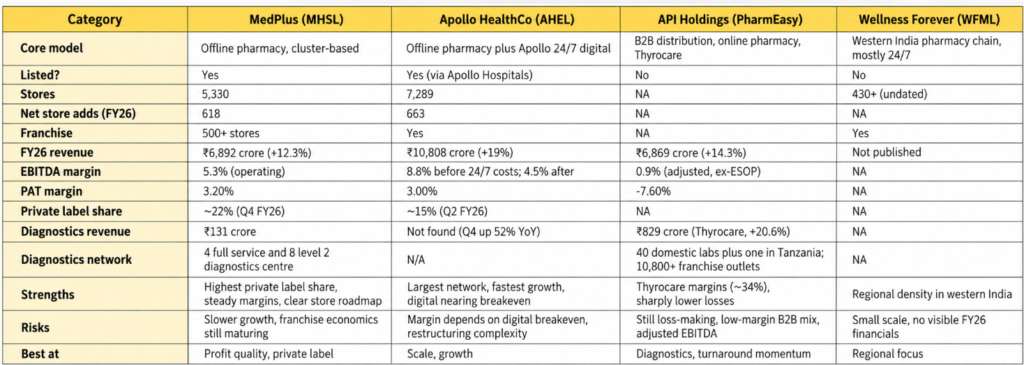
MedPlus Health Services Ltd sits between Apollo HealthCo and the rest of the peer group, with the cleanest retail economics of the four. It is smaller than Apollo HealthCo, with 5,330 stores against 7,289 and about ₹6,892 Cr of revenue against ₹10,808 Cr, and it is growing more slowly at 12.3% versus 19%. Even so, it matches Apollo on profitability, with a 3.2% PAT margin against 3.0%, and it gets there on a steadier, store-led model rather than a digital turnaround. Its private label share of about 22% is well above Apollo’s roughly 15%, and that is its main margin lever. Against PharmEasy, which is still loss-making at about (7.6%) PAT margin and 0.9% adjusted EBITDA, Medplus Health Services Ltd is far more profitable. PharmEasy’s Thyrocare business, though, is a much stronger diagnostics asset than Medplus Health Services Ltd ₹131 Cr diagnostics arm. Wellness Forever is the smallest peer at 430+ stores, and its FY26 Financials are not yet public.
The other peer one can compare Medplus Health Services is pharma distributor Entero Healthcare. One of the big questions investors need to ponder over is this – which segment will organize faster? Pharma distribution or Pharmacy retail? Given that distribution is an intermediary, logically there is a higher possibility there assuming capital is available to back businesses like Entero Healthcare, Apollo Kiemed and API Holdings. In fact, a quicker than anticipated shift to organized pharmacy can affect the eventual prospects of Entero Healthcare. We already have a couple of detailed notes written on this business
Entero Healthcare business research note
Entero Healthcare – Why didn’t we invest though we liked the business?
Completing the entire value chain analysis of a business is something we genuinely enjoy at Congruence Advisers. It gives insights that go much deeper than analysis that is restricted to peer comparison within a single segment of the value chain.
Why You Should Consider Investing in Medplus Health Services Ltd
Headroom for Growth in India’s Organised Pharmacy Retail – There is a large scope for formalisation of India’s pharmacy retail market, as organised players constitute just 8-10% of the overall market. This contrasts with much higher levels of organised penetration in markets such as the UK, Russia and China. With growing healthcare awareness, an ageing population, increasing chronic diseases incidences, and increasing consumer preference for authentic and reliable medicines, customers are slowly shifting from traditional unorganised pharmacies to organised retailers. This structural shift presents Medplus Health Services Ltd with a large, underpenetrated market opportunity for long-term growth.
Strong Market Position with a Cluster-Based Expansion Strategy – MedPlus Health Services Ltd has established itself as the second-largest pharmacy retailer in India, with a particularly strong presence across key metro and urban markets. Its expansion strategy is focused on building density within existing markets rather than rapidly spreading across geographies. This “deeper than wider” approach allows the company to leverage its existing stores, supply chain, and customer base more efficiently. The dense store network also gives Medplus Health Services Ltd an advantage in omnichannel retail, as stores can function as hyperlocal fulfilment centres and enable faster deliveries, including deliveries within two hours, while keeping customer acquisition and logistics costs under control.
Private Labels Offer a Structural Opportunity for Margin Expansion – One of Medplus Health Services Ltd key growth levers is the increasing contribution from private-label and store-brand products across pharmaceuticals, FMCG and wellness categories. These products offer customers more affordable alternatives while allowing Medplus Health Services Ltd to capture better margins compared with several branded products. The company’s private-label revenue share increased from 19% to 22% in FY26, highlighting the growing importance of this segment. As the mix of higher-margin private-label products increases, Medplus Health Services Ltd has the potential to further improve its overall gross margins and profitability over time.
Vertically Integrated Supply Chain and Technology Capabilities – Medplus Health Services Ltd Health Services Ltd benefits from a relatively integrated operating model, with direct procurement from pharmaceutical manufacturers, regional distribution infrastructure, and an in-house technology platform supporting inventory management. This integration helps the company improve product availability, manage inventory more efficiently, and optimize procurement costs. Its technology-led approach also allows Medplus Health Services Ltd to use data across its store network to better understand demand and manage stock, which becomes increasingly valuable as the business scales.
Attractive Store-Level Economics and Maturing Store Base – The economics of individual stores remain an important part of the MedPlus Health Services Ltd investment story. Mature stores have demonstrated strong store-level returns, with ROCE in the range of around 45–65%. New stores typically require a period of ramp-up before reaching mature profitability, meaning the large base of relatively young stores provides an embedded earnings opportunity as they mature. If Medplus Health Services Ltd continues to maintain healthy store productivity while controlling expansion costs, the maturation of these outlets can gradually translate into stronger operating leverage and profitability.
Opportunity to Build a Broader Healthcare Ecosystem – MedPlus Health Services Ltd is gradually expanding beyond its traditional pharmacy business by adding healthcare-related services such as diagnostics. Its extensive retail footprint provides a ready customer base and physical network through which additional healthcare services can be offered. Over time, this could allow Medplus Health Services Ltd to capture a larger share of the consumer’s healthcare spending while creating cross-selling opportunities between pharmacy, diagnostics, and other wellness services. The broader opportunity is to evolve from a pharmacy retailer into a more comprehensive consumer healthcare platform.
What are the Risks of Investing in Medplus Health Services Ltd
Intense Competition and Pricing Pressure – Medplus Health Services Ltd operates in a highly competitive pharmacy retail market, facing competition not only from other organized pharmacy chains but also from e-pharmacies and increasingly, quick-commerce platforms. Competitors often use aggressive discounts and promotional offers to acquire and retain customers. This can put pressure on industry pricing and margins, particularly because branded medicines account for a significant portion of Medplus Health Services Ltd sales. Sustained discounting by competitors could therefore limit Medplus Health Services Ltd ability to expand margins and may require Medplus Health Services Ltd to balance customer acquisition with profitability.
Regulatory Restrictions and Price Controls – The pharmaceutical retail industry is closely regulated, with government policies directly influencing drug pricing and pharmacy operations. Essential medicines are subject to price controls under the Drug Price Control Order (DPCO), with the National Pharmaceutical Pricing Authority (NPPA) regulating prices for several products. These restrictions can limit the pricing flexibility and margins available to retailers. In addition, Medplus Health Services Ltd must comply with requirements related to pharmacy licences, prescription medicines, storage conditions, product traceability, and evolving regulations governing online medicine sales. Changes in the regulatory framework could increase compliance costs or affect the company’s operating model.
Private-Label Inventory and Expiry Risk – The growing private-label business provides Medplus Health Services Ltd with an opportunity to earn better margins, but it also introduces additional inventory risk. Unlike established branded products that are manufactured for the broader market, private-label products are produced specifically for Medplus Health Services Ltd through contract manufacturers. This means they bears greater responsibility for managing unsold, damaged, slow-moving, or expired inventory. With a large number of SKUs spread across stores and warehouses, effective inventory management becomes critical. Any deterioration in inventory turns or increase in expiry-related write-offs could negatively impact working capital and profitability.
Geographic Concentration and Supply Chain Dependence – Medplus Health Services Ltd has a significant presence in South India, with a large portion of its revenue coming from markets such as Telangana, Karnataka, Tamil Nadu, and Andhra Pradesh. While this concentration has helped the company build strong regional density, it also creates geographic risk. Local economic disruptions, regulatory changes, or competitive intensity in these markets could have a disproportionate impact on overall performance. In addition, the company depends on pharmaceutical manufacturers and wholesalers for consistent product availability. Any disruption in sourcing, logistics, or supplier relationships could affect inventory availability and customer service.
Expansion Drag and Potential Store Cannibalisation – Medplus Health Services Ltd continues to expand its store network, but new stores typically require time to reach mature revenue and profitability levels. As a result, rapid store additions can temporarily weigh on consolidated margins and profitability. Medplus Health Services Ltd’s strategy of building dense clusters also creates a potential cannibalisation risk, as new outlets may draw a portion of sales from nearby existing stores. While higher store density can improve delivery economics and strengthen the company’s local presence, the incremental revenue generated by new stores needs to be weighed against the impact on existing outlets.
Human Resource and Pharmacist Retention Challenges – Running a large pharmacy network requires a significant workforce, including qualified pharmacists and store-level employees. Recruiting and retaining trained personnel across thousands of outlets can become increasingly challenging as the company expands into Tier-2 and Tier-3 markets. Higher employee attrition can increase recruitment and training costs and may also affect store-level service quality. Sustained wage inflation or shortages of qualified pharmacists could therefore put pressure on operating expenses and store profitability.
The emerging challenge from online only players who are building offline scale – Though we think this threat is low since it is much easier for an offline player to go online than the other way around, the availability of easy capital can make this game much more even. As of date, Pharmeasy, Tata 1 MG haven’t been able to make a serious dent outside of metro India since broader India needs physical stores and warehouses to scale up
Risks emanating from promoter actions – We have already called out promoter holding pledging as a potentially serious risk in a bad capital market environment. We wish to see a day when the promoter holding is unencumbered and we don’t have to worry about this risk. Until then, it is a serious one to track nonetheless.
Medplus Health Services Ltd Future Outlook
The Medplus Health Services Ltd future outlook centers on four core operational and financial pillars:
1. Store Network Expansion
- Tier-2+ Focus: Medplus fulfillment hubs and warehouses are structured to improve fill rates, reduce stockout focusing expansion on Tier-2 cities and beyond to increase store density in established regional clusters.
- FY27 Net Store Target: The company maintains guidance for 800 net store additions in FY27, with franchise (FOFO) outlets serving as a primary addition channel.
- Reduced Gestational Drag: As the total store network expands beyond 5,000+ stores, new store additions represent a smaller percentage of the overall store base, minimizing the short-term margin drag caused by opening costs.
2. Private Label Expansion & Margin Accretion
- Incremental Margin Gains: Management targets a steady quarterly increase in private label contribution (~0.25% to 0.5% net sales growth), noting that every 0.5% increase in private label net sales yields roughly 0.2% (20 bps) in gross margin improvement.
- Expanded Product Range: The company continues to add curated SKUs across both pharmaceutical (specifically chronic and sub-chronic lines) and FMCG/wellness categories.
3. SSSG Outlook & Store Maturation
- Target SSSG: Management aims for a normalized full-year Same-Store Sales Growth (SSSG) of 9% to 10%.
- Maturation Pipeline: Stores operational for less than 24 months continue to ramp up toward full earnings potential, with mature outlets (>24 months) delivering store-level EBITDA margins of 10%+.
4. Omnichannel & Logistics Infrastructure
- Hyperlocal Delivery: Medplus Health Services Ltd is leveraging its proprietary technology platform and dense store network to extend <2-hour home deliveries across more locations.
- Supply Chain Efficiency: The rollout of new regional fulfillment hubs and warehouses is structured to improve fill rates, reduce stockouts, and lower incremental operational costs as regional cluster density builds
Medplus Health Services Ltd Technical Analysis
We consider technical analysis to be a useful input in taking medium-term investment decisions. Many a time, price action tends to lead to fundamental developments; this is too important an aspect to be ignored by retail investors who do not have access to management outside of common forums like investor calls & AGMs.
At Congruence Advisers, we like to consider both the long-term weekly chart and the daily chart to arrive at a view on price action. Combined with our understanding of fundamentals, we usually end up being better placed to be able to judge both the business cycle and the stock cycle. Playing the stock cycle right is extremely important for investors looking to extract significant alpha over the medium term.
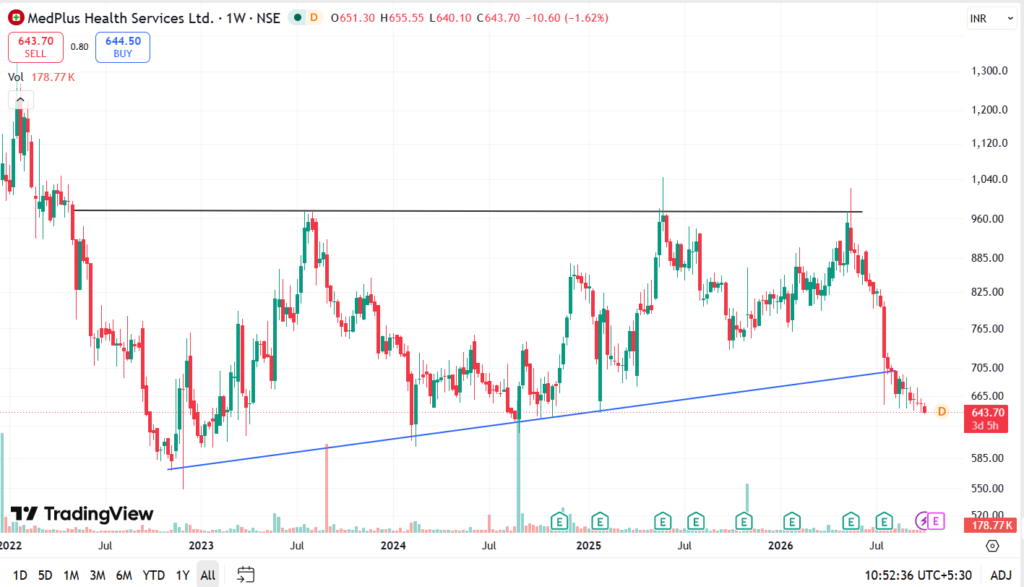
On a weekly chart, Medplus Health Services Ltd share looks precariously placed ever since the lower trendline was violated in July 2026. The stock saw a sharp fall with a big gap down on the day Q1 FY27 results were declared, the business disappointed on the margin front though revenue growth was healthy. Clearly the recent small cap bull run hasn’t been kind to this stock, though other segments within pharma have done very well.
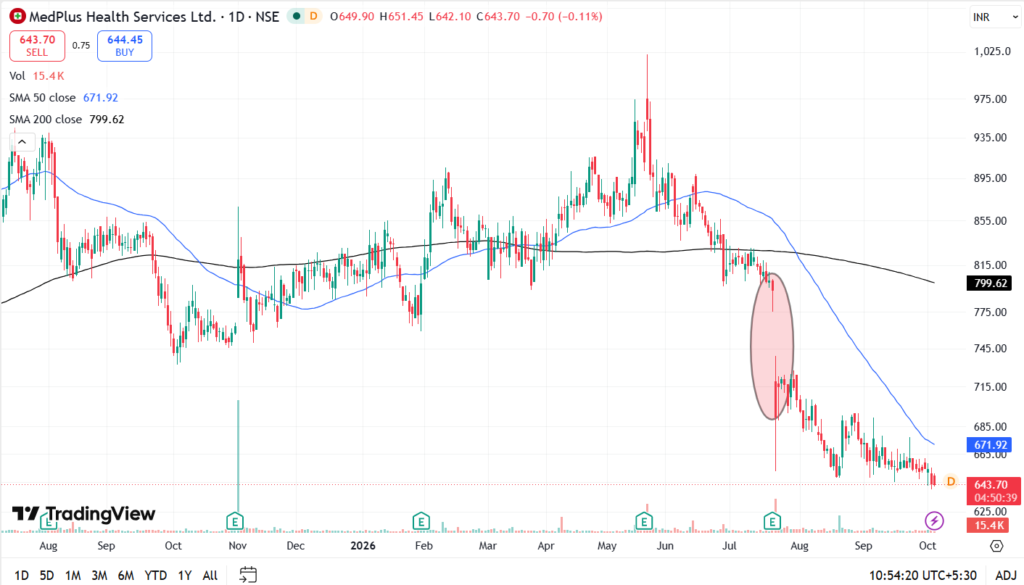
The day chart looks listless as well, with the 22 July gap down standing out as the largest element in the past 12 months. Clearly the price is in a significant downtrend, in such situations the indication should toggle back to the fundamentals. Without good numbers, technical analysis will tell us that we need to stay away for the time being.
A simple look at the trailing PE multiple tells the story on the fundamental side
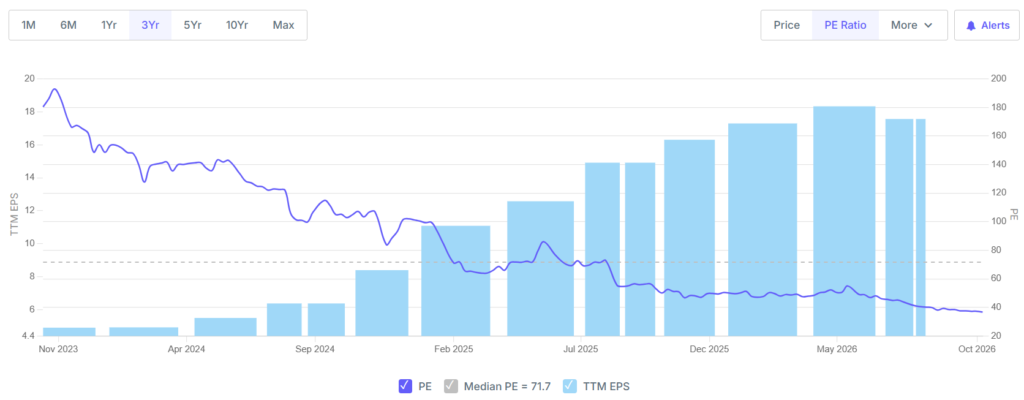
Even when the earnings growth was good between Sep 2024 and May 2026, a falling PE multiple indicates that the market wasn’t very enthused about the sustainability of this earnings growth rate. The current TTM PE multiple of 36x is the cheapest the stock has seen since listing, yet there are no takers for the stock right now. This should be a case study on the fragility of high starting valuation, even when the underlying numbers stay strong for a few years.
Medplus Health Services Ltd Latest Results, News and Updates
Medplus Health Services Ltd Quarterly Results
MedPlus Health Services Ltd. delivered a strong revenue performance in Q1FY27, with topline growth of ~22% YoY, driven by a higher mix of branded products and same-store sales growth (SSSG) of ~15% YoY. However, EBITDA margin contracted by 139 bps YoY and 199 bps QoQ, primarily due to a lower private-label mix, normalization of inventory provisions, and higher operating costs. Consequently, PAT margin declined by 97 bps YoY to ~2% in Q1FY27.
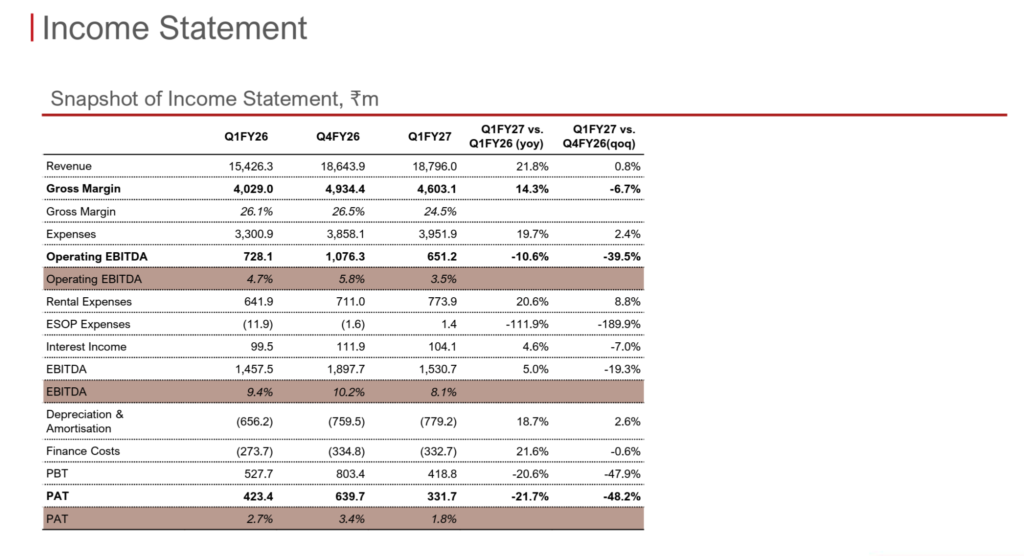
Private-label products contributed ~20% of total revenue, comprising ~10.7% from pharma private-label products and ~9.3% from non-pharma private-label products. Management expects the private-label mix to improve gradually over the next few quarters, which could support margin recovery.
On the operational front, MedPlus Health Services Ltd continued its aggressive network expansion, with 146 net store additions during Q1FY27, comprising 222 gross additions, taking the total store count to 5,476 stores as of Q1FY27. The company remains focused on rapid network expansion and has retained its target of 800 net store additions in FY27.
Final Thoughts on Medplus Health Services Ltd
Medplus Health Services has always been of interest to us due to the long growth runway, respectable scale and a leading brand image in the pharmacy retail segment. However, valuation never made sense to us given the promoter pledging risk and the optical skew of the numbers due to IND AS reporting. At a current market cap of 7,750 Cr, TTM PAT of 265 Cr and operating cash flow of 175 Cr don’t give enough comfort on the valuation front. While we believe that the business can keep growing at a healthy rate due to new store openings, the quality of the business will be predicated on improving gross margin and the ability to deliver operating leverage on a continuous basis.
Our assessment tells us that high store opening phases can take a toll on the immediate future due to higher operating costs, increasing gross margin will need to be a counterbalance to this capex to ensure that PAT growth can stay healthy on a YoY basis. As of date, we do not have enough confidence in the business to be able to pull this off consistently over the next 3-4 years. At an operating margin of ~4% pre IND AS, the business doesn’t have enough buffer to accommodate any fall in gross margin for even a few quarters.
Given the risks in the business and the low margin, working capital intensive nature, investors will have to be choosy on the valuation front to build a buffer against volatile margins for a few quarters. At CMP the business trades at 36x TTM PE and doesn’t yet offer this buffer in our opinion. We will continue to track this business within our coverage universe until something changes for the better – lower entry valuation, higher gross margin and stronger operating cash flow profile.
Disclaimer – This note is part of a business research & analysis series on small companies, there is no BUY/SELL recommendation or target price issued as part of this to a general audience. There is no assurance that this stock makes for a good investment, there is no guarantee that this stock will continue/be included in the coverage universe of Congruence Advisers. The note contains some forward-looking statements and insights drawn from the historical results, annual reports and investor presentations; they are to be viewed only within this context and not as a prediction of future performance of the business or the stock covered.
While due care has been taken to ensure that the information here is as accurate as possible, Congruence Advisers disclaims any liability in case of any unintentional inaccuracies.
The content does not constitute investment advice.