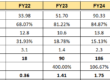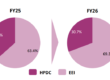
WeWork India Ltd was established in 2016 under an exclusive franchise partnership with WeWork Inc and promoted by the Embassy Group. WeWork India Ltd is the India largest flexible workspace platform by revenue, profitability and market capitalization. With a presence across the country’s most important business districts.
Table T1
WeWork India Ltd offers an interesting way to play two structural India themes at once: the rise of GCCs and a continuing shift toward Grade-A, flex-ready space. The flex industry itself is still early, with stock across the top 7 cities projected to grow from ~103 MSF to ~236 MSF by CY30, an 18% CAGR. It’s also a business with limited structural barriers to entry, operators can replicate the model with capital and a landlord relationship. Even so, WeWork India Ltd has built a known brand to some extent and commands a bit higher pricing power relative to the flex universe, backed by a blend of global brand recognition and a domestic promoter in Embassy Group, whose real estate expertise and sourcing relationships give it preferential access to Grade-A supply that a standalone operator would struggle to replicate. With growth, occupancy and pricing all moving in the same direction, WeWork India Ltd looks well placed to grow through this still-early phase of India’s flex cycle.
We Work Global
It’s useful to understand the global experience of WeWork’s franchise model before diving into the story in India.
WeWork started with two friends sharing a building in Brooklyn. In 2007, architect Miguel McKelvey had the idea of sharing office space in the Dumbo neighbourhood with Adam Neumann. Neumann was then running a baby clothing business named Krawlers which sold pants with built-in kneepads. Both noticed their building was part empty. They persuaded the landlord (which was not easy at that time) to let them rent out small sections of the vacant floors to other entrepreneurs.
They started GreenDesk in May 2008 in partnership with the same landlord. It provided short leases of furnished subdivided offices, with a brand hook of green ecosystem.
The floor plan, business plan and website was designed by McKelvey. The timing also favoured them. The 2008 financial crisis had left New York with empty offices with crisis affected workers starting their own businesses who could not afford a traditional large office on long lease. So within months of launching GreenDesk they had about 350+ tenants and had expanded into a second building.
Why did they sell GreenDesk ?
There were two reasons. First, the landlord was a shareholder with veto power and he did have a growth mindset and didn’t want to expand beyond current size, while Neumann did. Second, the founders realised that tenants valued the community, not the green branding. To build that at scale they needed to own the whole model. In 2010, they sold their stakes to the landlord, Joshua Guttman for $500,000 each.
Founding WeWork (2010 to 2016)
With about $1 million from the sale and a $15 million investment from real estate developer Joel Schreiber for a 33% stake, they opened the first WeWork in SoHo, New York, in 2010.
The model was simple: take long leases on large commercial floors, redesign them with strong design and community perks and sublease desks and private offices on short and flexible terms.
The spread between the long lease and the short sublease was the profit. It is structurally similar to a bank business model of spreads.
The early product worked. Startups and freelancers liked the design and the community. By 2014 the valuation was $1.65B and by 2015 the company had 50 locations.
The SoftBank era (2017 to 2019)
Masayoshi Son of SoftBank met Neumann and committed $4.4B after a short meeting of about 12 minutes. SoftBank follows a similar approach with Wework what softbank is known for i.e to give the leader of a category so much money that rivals cannot compete.
For WeWork this meant growth at any cost. So they started expanding aggressively by following the softbank template by opening hundreds of locations across more than 100 cities. Revenue rose fast, but so did losses, because each site needed large fit-out spending and lease deposits before a single desk was let and that too at the cost of higher rent. In January 2019 the valuation peaked at $47B. Total funding raised between 2010 and 2019 was $12.8B.
In FY2018, WeWork lost $1.9B on $1.8B of revenue.
The S-1 and the failed IPO (August to September 2019)
The IPO filing in August 2019 gave public investors their first clear look at the business. The main concerns were:
- Losses of $1.9B on $1.8B of revenue
- About $47B of future lease obligations against roughly $4B of committed income
- Neumann personally owned buildings and leased them to WeWork, which was a clear conflict of interest
- Supervoting shares with 20 times the votes, which gave Neumann near-total control
- The “We Company” rebrand (attempted to reposition itself from a coworking and commercial real estate business into a broader lifestyle ecosystem by expanding into adjacent ventures such as WeLive (co-living), WeGrow (education), and Flatiron School (technology education)
Investors pushed back and the IPO was pulled within weeks. Neumann was removed as CEO in late September 2019 with an exit package of about $1.7B, while employees were left with options that had lost their value. The valuation fell from $47B to about $8B in six weeks, and 2,400 employees were laid off in 2019.
Pandemic and SPAC listing (2020 to 2021)
COVID wave hit WeWork’s business directly. Dense and shared offices were the wrong product for a pandemic. Occupancy fell sharply but their lease outgo continued on hundreds of empty floors.
SoftBank provided emergency funding. In October 2021, WeWork listed on the NYSE through a SPAC merger with BowX Acquisition Corp at a $9B valuation, far below its $47B peak. Lease costs were about 2/3 of operating expenses, cash burn continued, and hybrid work was reducing demand for office space.
Decline and Chapter 11 (2022 to 2023)
After the listing, the stock fell from about $50 to single digits. Rising interest rates, hybrid work and continued cash burn all weighed on it. In summer 2023, WeWork disclosed substantial doubt about its ability to continue as a going concern . On November 6, 2023, it filed for Chapter 11 bankruptcy protection. SoftBank’s cumulative losses on WeWork reached $16B.
The restructured company (June 2024 onwards)
WeWork emerged from Chapter 11 in June 2024 with a court-approved plan:
- About $4B of debt was removed
- Future lease obligations were cut by about $12B, or roughly 50%
- $400M of fresh equity was raised
- SoftBank, once the owner of about 70%, was reduced to a minority stake
- Yardi Systems, a real estate software company, became the largest shareholder at about 60%
- WeWork kept about 600 of its best-performing locations globally
By early 2025, WeWork reported six consecutive months of positive global EBITDA. Revenue for 2025 was about $3.98B, up 8.5% year on year. However, the company is still not profitable at the net income level, and cash flow is slightly negative because of continuing spending on upgrading locations.
WeWork India
The story starts in 2015, with a 24-year-old who had just joined his family’s real estate business. Karan Virwani’s father, Jitendra Virwani, had built Embassy Group into one of India’s largest real estate developers (mostly in bangalore) the kind of firm that leased space to Tata Consultancy Services, Goldman Sachs and Rolls-Royce.
Karan was familiar with that world. But he had also been spending time around Bengaluru’s startups, watching companies like Flipkart and Freshworks grow out of small, informal spaces, and he sensed that India’s next generation of businesses needed something the traditional 500,000 sq ft corporate lease could never give them. Around the same time, WeWork Global was scouting for an India entry. Karan along with Jitendra Virwani (two person negotiating team) flew to New York, met Adam Neumann, and came back convinced that the model would work in India. The only question was what shape the deal should take.
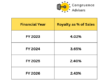
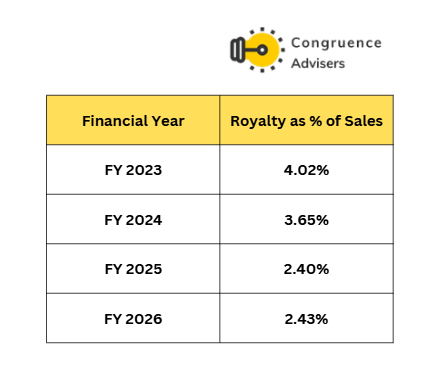
That question took most of a year to answer. What Embassy and WeWork signed in 2016 was unlike anything WeWork had done in its other 28 markets. Elsewhere, WeWork either ran the business entirely on its own capital or brought in a partner while keeping majority equity and operational control. In India, it did neither. Embassy put up all the capital, built the centres and ran the operations, ending up with close to 90% of the equity at the start, later settling near 76%. WeWork Global, in return, simply licensed its brand and operating playbook for a fee, (initially reported number was around 12% of revenue, now has fallen to <2.5%). It took no equity, no board seats and, just as importantly, took on no liability. This choice turned out to be one of the best decisions in WeWork India Ltd’s history.
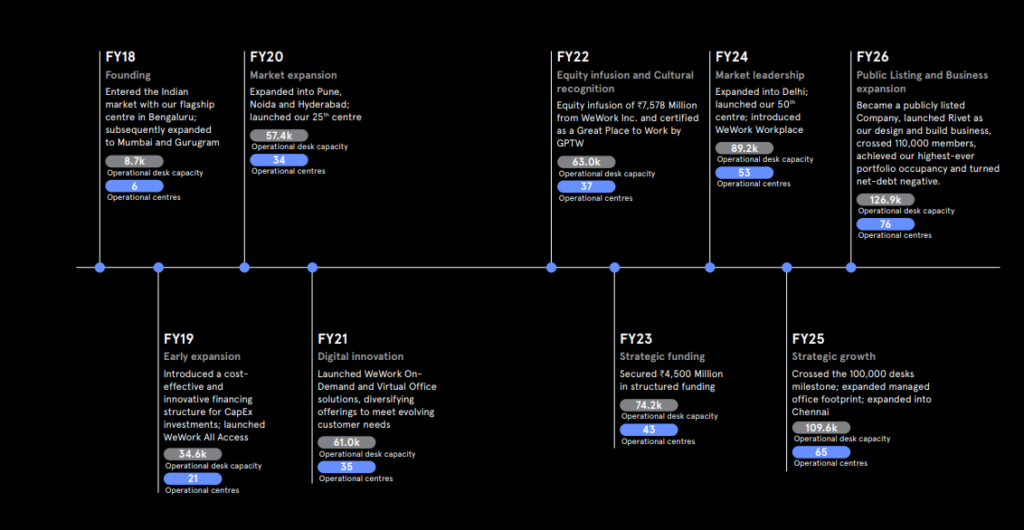
The first centre opened in July 2017 on Residency Road in Bengaluru, inside a building Embassy already owned. It was a 140,000 sq ft, six-storey space with 2,200 desks, a Jacuzzi and a rooftop gym, built with the same exposed-brick, neon-sign aesthetic that had made WeWork famous in New York. The timing also played a key role. Startup funding in India was climbing from about $5B in 2015 toward $13B by 2019, and Bengaluru’s being the tech capital was in the forefront of this. Timing was one thing but its real advantage was access to Grade A office space through the Embassy group. While at same time other co-working operators had spent months chasing landlords for Grade A space and negotiating deposits.
By November 2018, the NBFC crisis had frozen lending across India, and WeWork India, still too young for private equity and not backed by outside capital, found itself unable to raise money at the exact moment it needed a lot of it. Embassy had to reach into its own balance sheet, putting in ₹1,000 Cr of promoter equity and arranging another ₹200 Cr from ICICI Bank against a pledge of its WeWork stake. Less than a year later, the shock came from the other direction. WeWork Global’s IPO filing fell apart, the $47B valuation collapsed to about $8B within weeks, and Neumann was pushed out.
There was even a moment, at the height of the pre-IPO mania in mid-2019, when WeWork Inc considered paying $1.9 bn to acquire the India franchise outright and fold it into its own books. This also lined up with Embassy Group’s original plan, which was to eventually offload the business to WeWork Global once it had scaled it up. While the global business was unravelling through 2019, Embassy Group kept stepping in publicly to clear the doubts, repeating the same point again and again that WeWork India was not WeWork Inc and American creditors had no claim on the Indian business. By Virwani’s account, WeWork India was hitting peak sales at the exact moment the American parent was falling apart.
COVID arrived next, and it hit the co-working model at its core. Densely packed, shared, hot-desked space was the wrong format for a pandemic, and occupancy collapsed as enterprise clients froze their real estate decisions. It renegotiated leases, cut costs and waited out the worst of it. Relief came in June 2021, when WeWork Inc, by then under new management appointed by SoftBank and led by CEO Sandeep Mathrani, invested $100 mn into the Indian business for a 27% stake, with Embassy retaining 73%. The capital landed at the right moment, helping WeWork India clear vendor liabilities and stabilise through the pandemic’s second wave, and it funded expansion into new cities including Delhi in 2023 and Chennai in 2024.
That independence was tested one more time on November 6, 2023, when WeWork Inc filed for Chapter 11 bankruptcy in New York and Canada. It was front-page news everywhere, and within hours Virwani issued a statement making the same argument he had been making since 2019: WeWork India operates independently, its members and landlords are unaffected, and it continues to hold the rights to the brand with a 99-year licence agreement with WeWork Inc.
By 2024, Embassy Group needed that capital back for its other business lines, and had been trying to raise outside investment, but the valuations on offer weren’t good enough to justify a sale. A glimmer of hope came in 2024, when rival Awfis Space Solutions pulled off a successful IPO and showed there was real investor appetite for listed flex-space businesses in India. WeWork India filed its own IPO documents in early 2025, and the application sat with SEBI for five months.
Even after approval came through in mid-July, the process wasn’t entirely clean. There were complaints that the offer documents hadn’t fully disclosed criminal proceedings involving the Virwani family, proceedings that were eventually quashed. The IPO still went ahead, though the market’s response was mixed: retail investors subscribed to just 61% of their reserved portion, while institutional buyers oversubscribed 1.79 times. On listing day, October 10, the stock dipped as much as 5% below its ₹648 issue price intraday before closing at ₹632.
The ₹3000 Cr IPO issue was entirely an offer for sale; split between – Embassy selling ₹2295 Cr worth of shares and WeWork Global selling ₹706 Cr worth of shares
WeWork India Corporate structure
WeWork India is promoted by the Embassy Group. Founded in 1993 by Jitendra Virwani, Embassy Group is one of India’s largest real estate conglomerates with over 100 mn sq ft delivered across cities, though the bulk of its portfolio sits in Bengaluru.
The group is diversified across nearly every type of real estate & real estate linked businesses and have other listed companies too. Embassy Developments,(listed by merging Embassy’s residential and commercial project entities into Indiabulls Real Estate in 2020) builds and sells residential and commercial projects; Embassy REIT (India’s first listed REIT run with Blackstone) holds Grade A office assets; WeWork India Ltd is the flexible workspace arm; other unlisted companies are Embassy Services for facility management; Embark for GCC enablement; and Olive Hospitality runs hotels and co-living, alongside smaller Interiors, Education and Equestrian businesses
The key to a successful real estate business in India is active promoter involvement, which plays a crucial role in building and scaling businesses. Despite the presence of several large corporate houses in Indian real estate, they are hardly present in India top 10 players with Godrej Properties being an exception which too is backed by active promoter involvement.
Therefore we view the Embassy Group’s backing and the Virwani family’s active involvement as a potential strength for WeWork India Ltd.
Also, Embassy Group’s local ties extend into Karnataka’s political establishment as well. The group has had a documented business partnership with K.J. George, a senior Congress leader who has held Home Ministry and other portfolios in past Karnataka governments and remains an influential figure in the state ruling party.
35% of Embassy Group WeWork India holding is pledged for group level (non-WeWork related) financing needs. This isn’t an immediate red flag but we believe it is a sensible part to be closely monitored going forward and one needs to keep watch on the embassy group’s financial profile too.
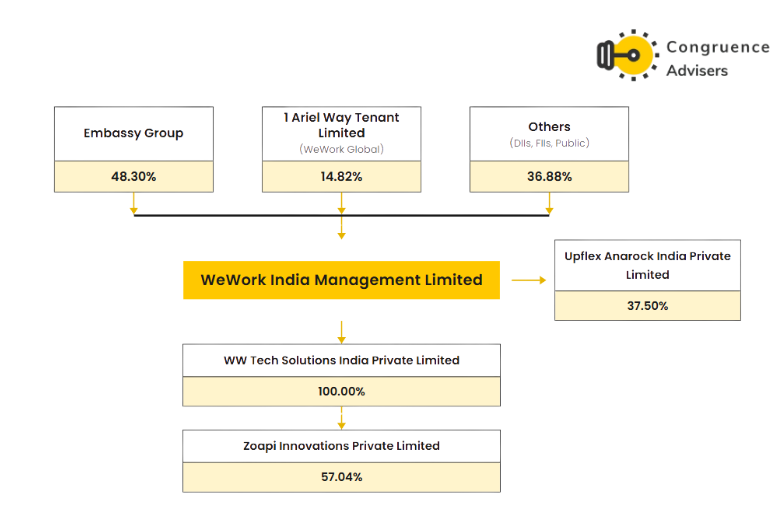
* WeWork Global (via 1 Ariel Way Tenant Limited) recently in August 2026 sold a 2.52% stake for approximately ₹244 Cr, with buyers including ICICI Prudential Mutual Fund, Motilal Oswal AMC, Motilal Oswal Mutual Fund, HDFC Life, and Citigroup.
WeWork India Ltd royalty as % of revenue to WeWork Inc
SUBSIDIARIES & ASSOCIATES
WW Tech Solutions India Private Limited is established for offering tech-based solutions to WeWork India’s clients. It is the technology subsidiary, not a revenue arm in itself, but an integral part of the core business.
Zoapi Innovations Private Limited is a subsidiary company that develops meeting-room & workplace collaboration technology, wireless presentation, video conferencing, meeting room scheduling, digital signage. This is the software which de facto operates WeWork’s conference rooms. This is a supporting utility which maintains the working nature and uniformity of the conferencing product from centre to centre.
Upflex Anarock India Private Limited (37.50%) – Leading marketplace for flexible workspace solutions in India, myHQ by ANAROCK.
WeWork India Management Details
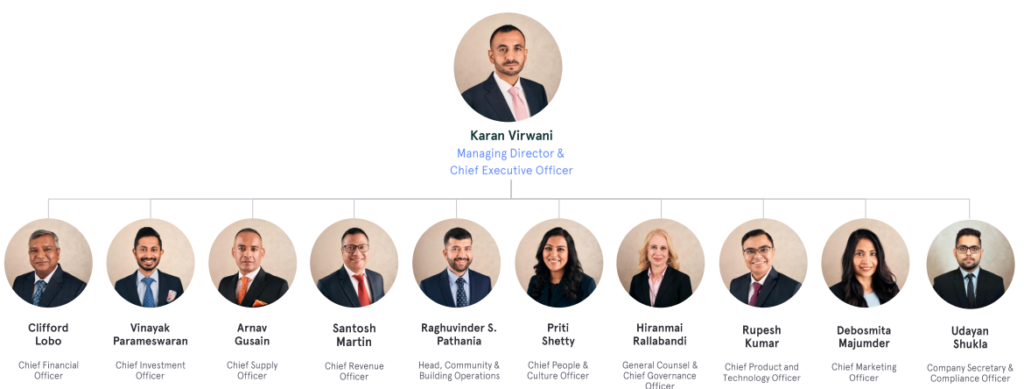
Karan Virwani, from the Embassy Group family, leads WeWork India as MD & CEO, backed by strong promoter support and strong ties into the broader real estate ecosystem. Below him, The core team, which includes CFO Clifford Lobo, CIO Vinayak Parameswaran, Supply head Arnav Gusain and Legal head Hiranmai Rallabandi, have been on the job for years. Finance / revenue / technology / people and operations coverage is well balanced for functional coverage.
Industry Overview
India Commercial Real Estate Market
India’s Grade A office market has moved through three distinct phases. From pre-2003 to 2010, it was a slow build, taking over 15 years to go from roughly 44 MSF to 309 MSF. This was the era of the original IT/ITeS boom but supply additions were gradual. Developer capital in this period is more leaned towards the residential segment, Even the preferred asset class for institutional and PE investors during this period was more toward residential. Although institutional money hadn’t arrived into Indian real estate at scale yet.
Between 2011 and 2018, the market changed character. Grade A stock nearly doubled in just 8 years from around 341 MSF to 591 MSF, as MNCs, BFSI players and Indian corporates, alongside an emerging startup ecosystem, began scaling demand well beyond the traditional IT services base. At the same time, institutional and developer capital pivoted decisively toward commercial, as residential faced a cyclical slowdown through this period, weak sales velocity, oversupply, and eventually the 2018 NBFC crisis. Office investment had actually overtaken residential as the preferred asset class for institutional investors and commercial investment volumes rose roughly 6 fold between the first and second halves of this window. In effect, this was an institution chasing-yield era; capital that had been parked in residential areas started moving into office because that’s where the growth and the returns were.
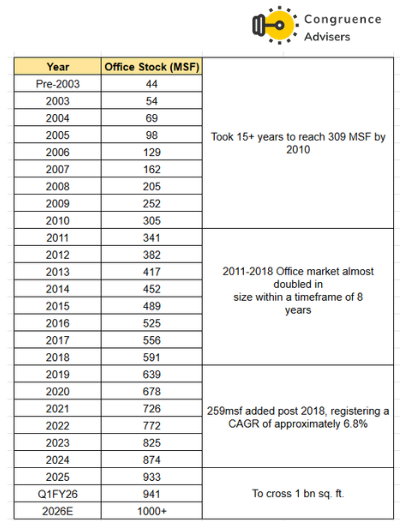
Since 2018, the market has added roughly 259 MSF, growing at a CAGR of approximately 6.8%, even after absorbing a global pandemic that was supposed to structurally dent office demand. Stock has since crossed 950+ MSF. This is also the phase where public and institutional capital entered the market directly. Embassy REIT listed in April 2019, followed by Mindspace REIT in August 2020 and Brookfield India REIT in February 2021, and more recently Knowledge Realty Trust listed in August 2025 & Bagmane REIT listed in may 2026. Taking the total to 6 listed REITs, 5 of them pure-play commercial office platforms (Nexus Select Trust is retail focused).
What’s interesting here is that this is also the phase that includes COVID, and the market didn’t just recover, it kept growing through it, with institutional capital continuing to back the asset class through the worst of the disruption. The real driver behind this resilience has been GCCs. Post-COVID, global capability centres have become the single largest source of incremental office demand in India, multinational companies consolidating and expanding their India operations at a pace that has more than offset the hybrid-work drag seen in other markets.
The read-through is that Grade A office demand in India has proven far more resilient to the hybrid-work shift than the market feared in 2020-21, and GCCs & large-format enterprise occupiers are the main reason why.
Going forward, the market is forecast to witness average annual supply addition of approximately 65-75 Mn sq. ft. during CY2026 – CY2028
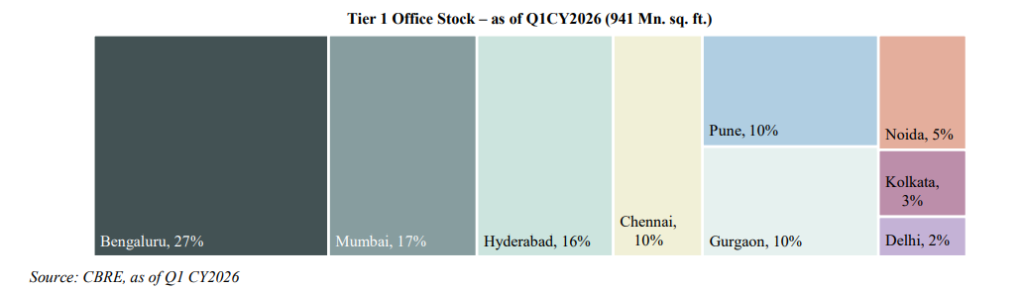
As of Q1 2026, India’s organized commercial office stock stood at an estimated 960+ Mn sq. ft., concentrated predominantly across the top 9 cities (Tier 1 cities) comprising of Bengaluru, Delhi-NCR (Gurgaon, Noida, and Delhi), Mumbai Metropolitan Region, Hyderabad, Chennai, Pune, and Kolkata, which together account for 90-95% of office stock in India.
Evolution of Office Stock in India
India’s office market has moved through 5 fairly distinct phases. Before 2000, demand came mostly from government, PSUs and traditional corporations, in small, developer-owned buildings with few amenities.
Between 2000 and 2012, IT and BPM growth, SEZ policy and rising MNC presence pushed the market toward campus-style Grade A parks, though still fairly basic. From 2013 to 2020, larger integrated business parks and green buildings became the norm, and flexible workspace started appearing as a real category, driven by startups, incubators and MNCs wanting high-end space without long-term commitment.
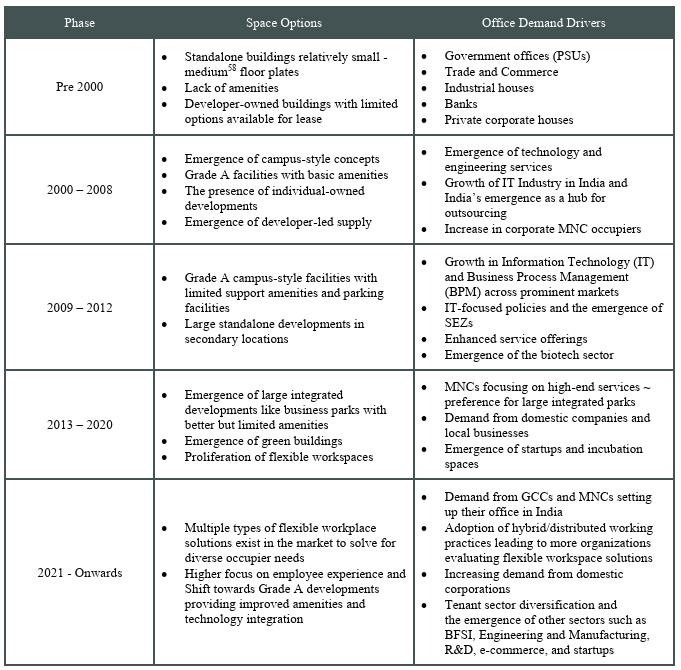
Since 2021, the market has diversified further: GCCs and hybrid work have pushed demand for flexible solutions across a wider range of sectors, BFSI, engineering, e-commerce, etc with a sharper focus on amenities and employee experience.
Top 9 Indian Cities – Supply, Gross Absorption Vacancy as of Q1 CY2026
India’s office market took a hit in 2020 and 2021. Gross absorption fell from 66.6 Mn sq ft in 2019 to 35.1 Mn sq ft in 2020, as occupiers put space decisions on hold due covid 19. Recovery began in 2022 at 62 Mn sq ft and has since printed growth in each year, reaching a record 82.6 Mn sq ft in 2025.
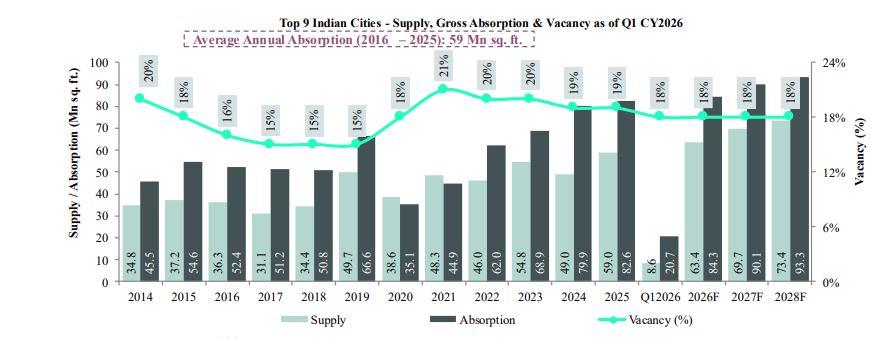
Q1 2026 is off to a strong start, with 20.7 Mn sq ft absorbed against only 8.6 Mn sq ft of new supply. Absorption is forecast to reach 93.3 Mn sq ft by 2028, with supply at 73.4 Mn sq ft
Vacancy averages 18% across the Tier I cities, but the spread is wide. Kolkata (8%), Chennai (13%), Mumbai (14%) and Bengaluru (15%) are lower, while Hyderabad (25%), Pune (24%), Gurgaon and Delhi (23% each) are on the higher side.
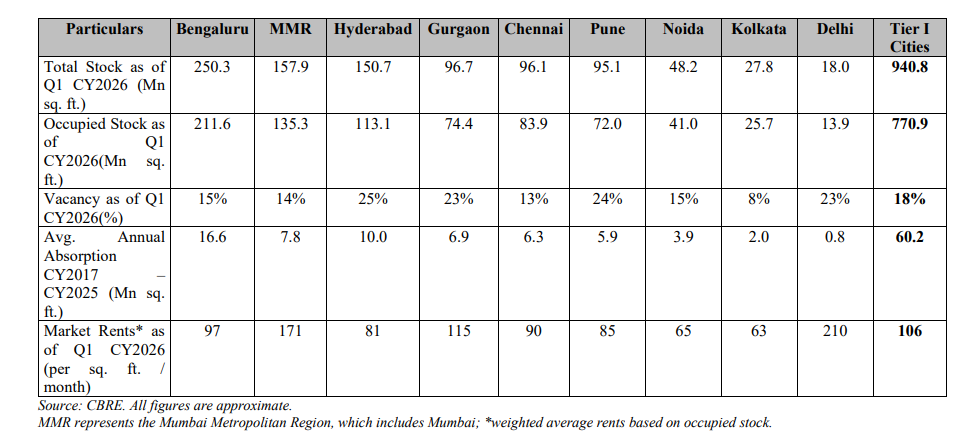
On rents, Mumbai commands the highest premium among all at ₹171 per sq ft per month backed by its position as the financial capital. Hyderabad and Pune are softer and cheaper at ₹81 and ₹85. Delhi has the highest rent overall at ₹210 but the smallest stock at 18 MSF, so the rent reflects scarcity of Grade A space in a few prime pockets like Connaught Place. Gurgaon also commands a premium at ₹115, helped by its concentration of MNC offices. Hyderabad’s vacancy comes from supply running ahead of demand, as unlimited FSI drove record completions, and it is now easing as new deliveries slow. Bengaluru is the largest market at 250 MSF, yet its average rent of ₹97 sits below the ₹106 average with vacancy at just 15%.
Capital Inflow in Real Estate Sector
Real estate has drawn steady equity money since 2018, about $65 bn in total, with 2025 the strongest year at $13.5 bn. Land parcels and office assets have been the main targets throughout.
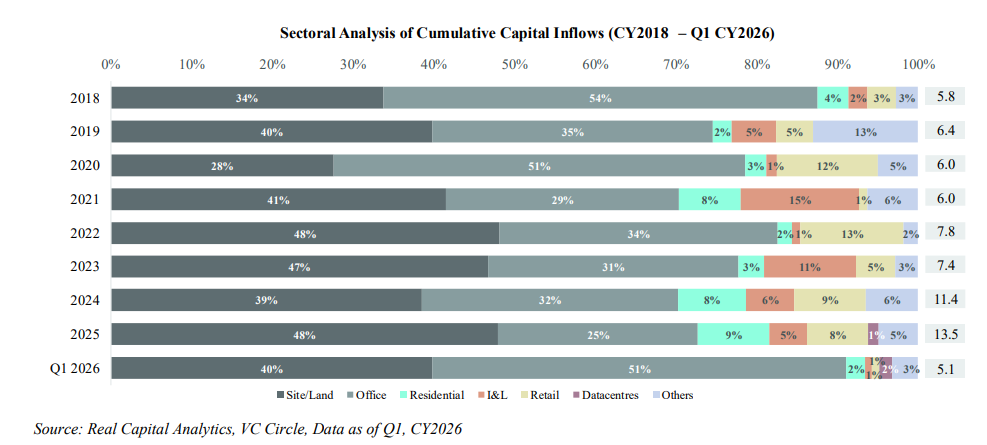
In Q1 2026, offices moved back ahead of land, pulling in about $2.6 bn, 51% of the quarter’s $5.1 bn. The money is also concentrated towards Tier 1 cities as they account for over 90% of office inflows in CY2025.
Global Capability Centres – Charting a New Technology Era and Driving Growth
GCCs have become India’s biggest office demand driver. Their model has moved from a cost-arbitrage outpost before 2010 to a centre for digital transformation and global business roles today, and NASSCOM sees the next stage as a full transformation hub.
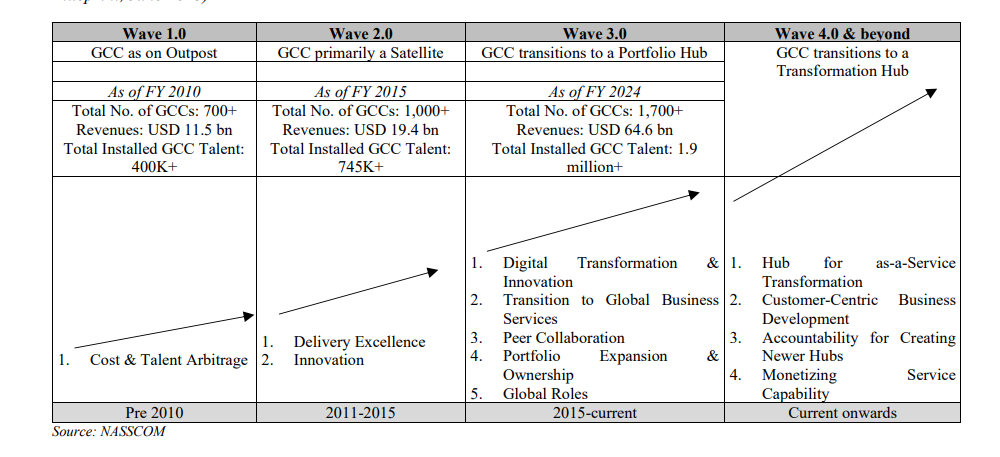
In the last five years India added over 500 new GCCs and more than 1,000 units. Total units rose about 38%, from 2,700+ in FY21 to 3,720+ in FY26 and roughly 25% of the Global 2000 MNCs now have a centre in India. NASSCOM expects 4,300-4,400 units by FY2030.
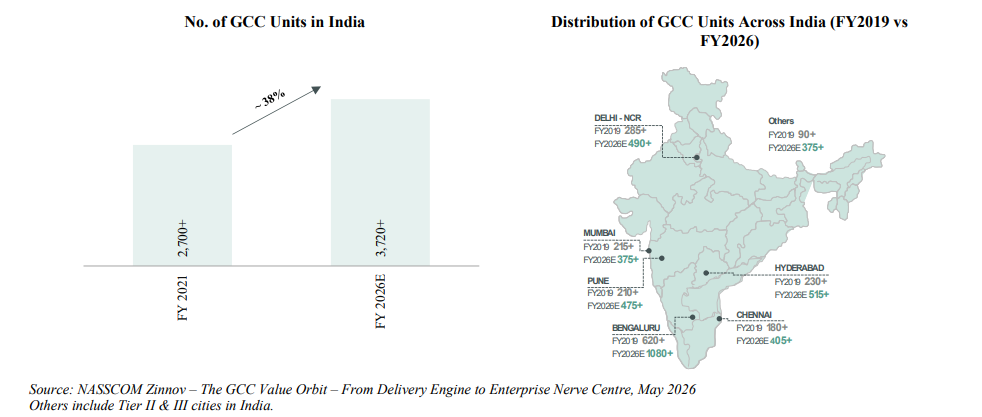
Bengaluru leads with 1,080+ units, followed by Hyderabad (515+) and Delhi-NCR (490+). Talent, digital skills and good office space keep pulling companies in, and GCC headcount has reached 2.36 mn.
GCC leasing across the Tier I cities, during CY2022 – Q1 CY2026, was primarily driven by occupiers across Technology (22%), BFSI (22%), Engineering & Manufacturing (17%), Research, Consulting and Analytics (11%), and Life Sciences (9%) sectors.
A large share of new GCCs are choosing flexible and managed offices over conventional leases, because they get speed, capital efficiency and outsourced operations. That demand feeds the wider office market, and flex operators benefit directly.
Flexible Workspace Industry Overview
Flex space has moved from a niche startup product to a core part of enterprise real estate planning. Before 2015 it was mostly serviced offices and incubators. Co-working gained traction with startups from 2015, and from 2017 enterprises and Corporates, MNC, GCC became the main customers, which brought in managed offices.
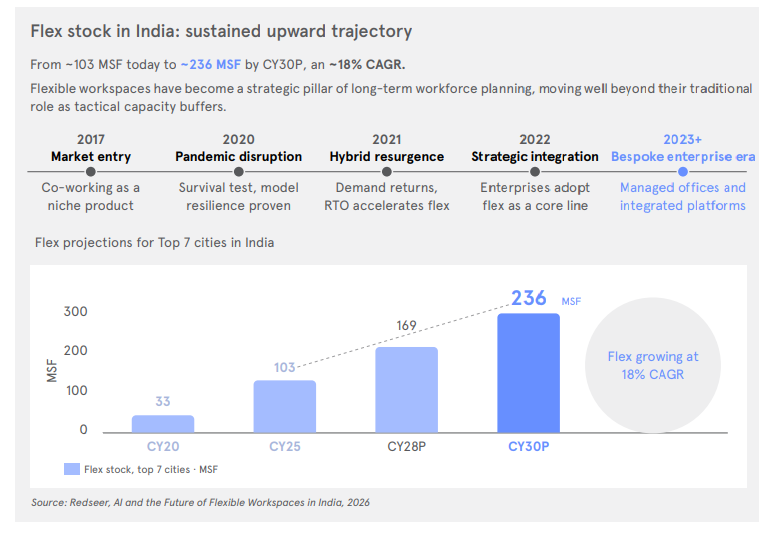
Since 2022, “core plus flex” has become standard, with companies keeping a fixed base and adding flexible space for expansion, and investor interest has grown. Flex stock across the top seven cities has tripled from 33 MSF in CY20 to about 105-110 MSF in CY25 (115-120 MSF in Q1CY26) and is projected to reach about 236 MSF by CY30, an 18% CAGR.
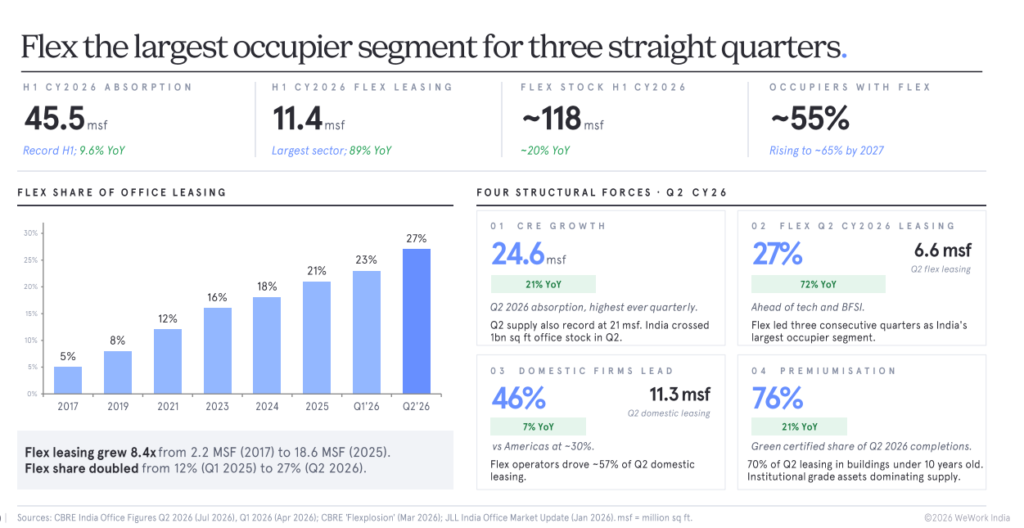
The demand for flexible workspaces in India has been well distributed between domestic and internationally headquartered organizations. Internationally headquartered organizations contributed to over 50% of the new/ expansion transactions closed across flexible workspace centres across India over the last 2-3 years. A similar trend has been observed in the case of managed office/enterprise transactions as well. Flex is the largest occupier segment in office stock for three straight quarters.
TAM for Flex Flexible Workspace Industry
By 2028, the total addressable market (TAM) for flex space is estimated at 330-350 Mn sq ft, or ₹98000-135000 Cr in annual revenue. That is a theoretical ceiling, not a forecast. It assumes flex operators could take up all the vacant non-SEZ office space, about 175 Mn sq ft of the 959 Mn sq ft stock expected by 2028, on top of the 162-166 Mn sq ft they are expected to hold by then. The revenue range comes from a weighted average rent of ₹130 per sq ft per month, with flex rent to revenue multiple at 1.9-2.5x.
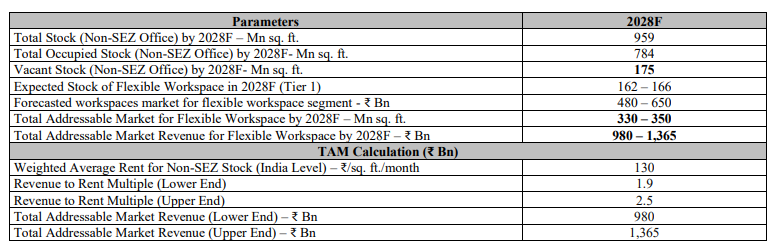
Against that ceiling, penetration is still low. Flex stock has nearly doubled over the last three to four years, but at just over 102 Mn sq ft (CY2025) it is only 10-12% of Tier I office stock. Even the forecast flex market of ₹48,000-65,000 crore in 2028 covers only about 5% of the TAM, which leaves a long runway.
WeWork India Ltd Business Analysis
WeWork India Ltd business is divided into four segments:
- Workspace – Core Operations (Private & Managed Offices), which accounts for the majority of revenue.
- Value Added Services (events, F&B, tech, etc.)
- Digital Products (All Access, Virtual Office, On Demand),
- Rivet (design & build), recently launched
1. Workspace as a Service (Core Operations) – Under WeWork India Ltd Core Operations (Workspace-as-a-Service) segment, the physical workspace offerings are broadly divided into two main products: Private Offices (WeWork Branded Spaces) and Managed Office
Private Offices (WeWork Branded Spaces) – Private Offices consist of turn-key, fully furnished, move-in ready private offices (for teams of 1 to 20+ members) and larger enterprise office suites within multi-tenant WeWork-branded centers. Members get 24/7 access to their dedicated office space along with shared access to building-wide professional amenities, including central receptions, common lounges, pantries, meeting rooms, phone booths, print nooks, and community events.
The model is executed via speculative space take-up, where WeWork leases Grade A building space from landlords, fits it out as a WeWork center, and leases individual desks or suites to multiple clients. Target Audience here generally are Startups, MSMEs, freelancers, and enterprises seeking plug-and-play scalability, geographic optionality, and flexible terms with Contract duration typical contract terms range from 12 to 36 months. This segment is the largest segment and contributes to 62% of consolidated revenue.
Managed Office (Bespoke Enterprise Solutions) – Managed Offices are custom-built, single-tenant, (full building) or dedicated floor (serviced floor) workspace solutions built strictly to the unique brand identity, architectural preferences, IT/networking requirements and operational needs of a specific enterprise client. WeWork India Ltd handles the complete lifecycle i.e Sourcing, Design, Build, and Operation. Clients receive exclusive private amenities such as branded receptions, executive offices, private lounges, dedicated pantries, and custom meeting rooms.
The model is executed via 100% against committed enterprise demand (zero speculative vacancy), ensuring immediate 100% utilization and capital-efficient returns from day one. The target audience here is Large corporate enterprises, Global Capability Centers (GCCs), and Fortune 500 companies looking to outsource office creation without taking on upfront capital expenditure with Contract duration typically secured under longer-term commitments ranging from 3 to 5 years (36 to 60 months).
Managed Offices is the newer of the two formats and has scaled to 26,000 desks across 1.7 mn sq. ft. in just two years, contributing 21.3% of total Revenue from Operations in FY 2026 (with an annualized run-rate exceeding ₹530+ Cr)
Unit economics and return profiles compare between Managed Offices and WeWork-branded workspace
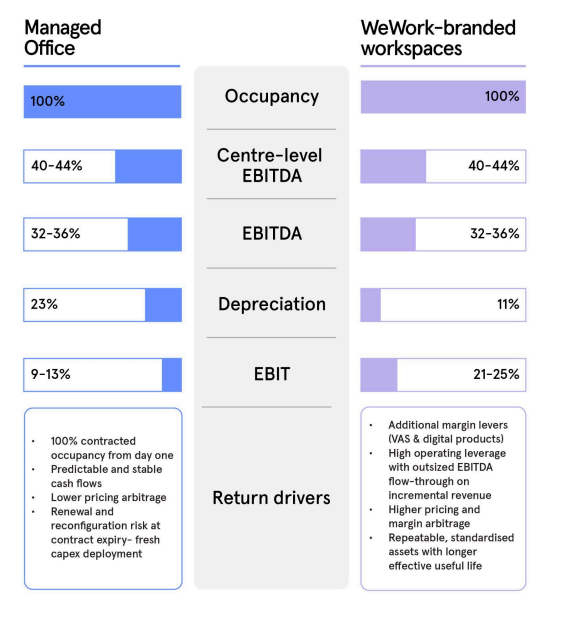
Managed Offices and WeWork-branded workspaces are structurally different formats, and their unit economics must first be compared on a fully utilised basis before considering occupancy risk. At 100% occupancy, Managed Offices and WeWork-branded centres operate at comparable centre-level EBITDA margins of 40-44%, reflecting similar gross operating efficiency at steady state.
The difference lies in how each format reaches and sustains that utilisation. Managed Offices commence operations at 100% occupancy from day one, given the direct linkage between supply and a committed enterprise client. While WeWork-branded workspaces, by design, ramp utilisation over time; once centres cross breakeven occupancy of 55%, incremental revenue carries very high operating leverage, with EBITDA flow-through approaching 90% as centres reach mature utilisation levels. After adjusting for 8% corporate overheads, comparable corporate EBITDA margins for both Managed Offices and WeWork-branded workspaces are in the range of 32-36%.
The true divergence emerges at the EBIT level, driven by fundamentally different depreciation economics. In Managed Offices, depreciation is a real economic cost. Spaces are highly bespoke and client-specific, with typical 4–5 year lock-in. While capex is recovered over the lock-in, the customised nature of these assets introduces renewal and reconfiguration risk, which often require reinvestment. As a result, depreciation is higher at 23% (useful life till lockin) yielding an EBIT margin of 9-13%.
While WeWork-branded workspaces benefit from proprietary, standardised design, allowing the same space to be resold across multiple customer cycles with limited refurbishment. While the economic useful life extends to 14 years, they conservatively assume a 9-year useful life in books, resulting in lower depreciation of 11% and a higher EBIT margin of 21-25%.
Beyond core workspace economics, WeWork-branded workspaces also benefit from incremental monetisation levers that are structurally absent in Managed Offices. Value-added services (currently 12% of revenue) and digital products (currently 3.3%) flow through at high margins on an already absorbed cost base, which drives disproportionate EBITDA expansion over time.
In summary, Managed Offices provide immediate scale and certainty, while WeWork-branded workspaces deliver superior long-term return through operating leverage, asset repeatability, longer effective useful life, and incremental monetisation making it a higher-margin return engine within the portfolio.
2. Value Added Services (VAS) – Value-Added Services encompass all non-rent, on-site services and amenities provided to members and enterprise clients within WeWork centers. They are designed to enhance the member experience, boost productivity, and drive higher spending per desk.
Key Product & Service Offerings
- Events & Hospitality – Leasing center event spaces, amphitheatres, and outdoor areas for corporate shoots, product launches, workshops, and fireside chats.
- Food & Beverage (F&B) – In-house cafes, managed pantries, and partnerships with F&B vendors (such as Chai Point) offering daily catering and refreshments.
- Customization & Spatial Tweaks – Specialized fit-out modifications, custom interior branding, IT racks, and custom acoustic setups requested by enterprise tenants.
- Technology & IT Support – Dedicated internet bandwidth, static IPs, specialized network hardware, and white-glove IT support.
- Parking Facilities – Monthly and daily vehicle parking passes across center basements.
- WeWork Business Solutions & Services Store – Curated marketplace offering HR, legal, administrative, hardware procurement, and marketing services to startups and enterprises.
This segment has printed ₹295.2 Cr revenue (+36.4% YoY) and contributes 12% of consol revenue.
3. Digital Products – Digital Products provide technology-driven, flexible access to WeWork’s global and national network without requiring long-term physical lease commitments. They cater specifically to hybrid workers, distributed corporate teams, remote freelancers, and digital nomads.
Key Product Offerings
- WeWork All Access – A global monthly subscription that allows members to drop in and work from participating WeWork locations worldwide.
- WeWork On Demand – A pay-per-use digital offering where users can book individual hot desks by the day or private meeting rooms and offices by the hour via the mobile app/web platform. It includes Day Pass Plus, a premium upgrade providing a dedicated desk in a shared private office.
- Virtual Office – A digital-first service enabling businesses to obtain an official business address within 15 minutes for statutory registrations, company incorporation, and mail handling without leasing physical space.
- WeWork Workplace – A cloud-based SaaS platform sold to enterprises to manage their internal hybrid workforce, desk booking, employee rostering, and office utilization analytics.
- WeWork India App : The integrated mobile backbone that ties the ecosystem together handling digital building access, desk/room bookings, community events, and service requests.
This segment has printed revenue of ₹82 crore (+23.5% YoY), contributing 3.3% of consol revenue in FY26. Digital products monetize the exact same physical square footage multiple times over and operate at an extraordinary EBITDA margin of close to 80%
4. Rivet – Rivet is WeWork India Ltd standalone Design & Build business pillar which is launched to deliver turnkey workspace design and construction for corporate enterprises, landlords, and developers without requiring a lease commitment within a WeWork centre.
It monetises over a decade of in-house design, procurement, and project management expertise gained from constructing over 9.1 mn square feet of Grade A workspace. Rivet was incubated internally over two years before being officially rolled out as an external brand in FY26.
Rivet operates across four distinct service offerings:
- Design & Build (D&B): Complete end-to-end office delivery covering brief formulation, concept design, budgeting, material procurement, construction, and final handover.
- PM Consultancy: Asset-light project management consultancy for clients managing their own contractors.
- In-House AOR / EOR: Architect-of-Record (AOR) and Engineer-of-Record (EOR) services covering architectural, MEP, IT/networking, security, and acoustic engineering without sub-contracting.
- Productised Kits: Standardised design modules and spatial kits built for rapid execution and repeatability.
Management launched Rivet with three objectives in mind. First, to retain enterprise clients who outgrow a WeWork centre and move into their own standalone headquarters, Rivet designs and builds that new HQ, so the relationship doesn’t end when the client exits. Second, to work the funnel in the other direction: corporate clients who first come to WeWork India for a standalone design-and-build project often convert into flexible workspace customers later, for satellite offices, swing space, or expansion into new cities. Third, Rivet creates an internal cost synergy, by handling design and build in-house, WeWork India cuts out the third-party consultant markups it would otherwise pay on its own Managed Office fit-outs.
Rivet runs on milestone-based payments with zero lease liabilities and no ROU depreciation, so EBITDA flows straight through to PBT with no rental leakage. Overall project margins run at 10-15%, with in-house design fees (AOR/EOR) at close to 100% margin. Revenue is still small at ₹22.52 Cr in FY26, up 48.5%.
WeWork India Ltd footprint in India’s key growth corridors
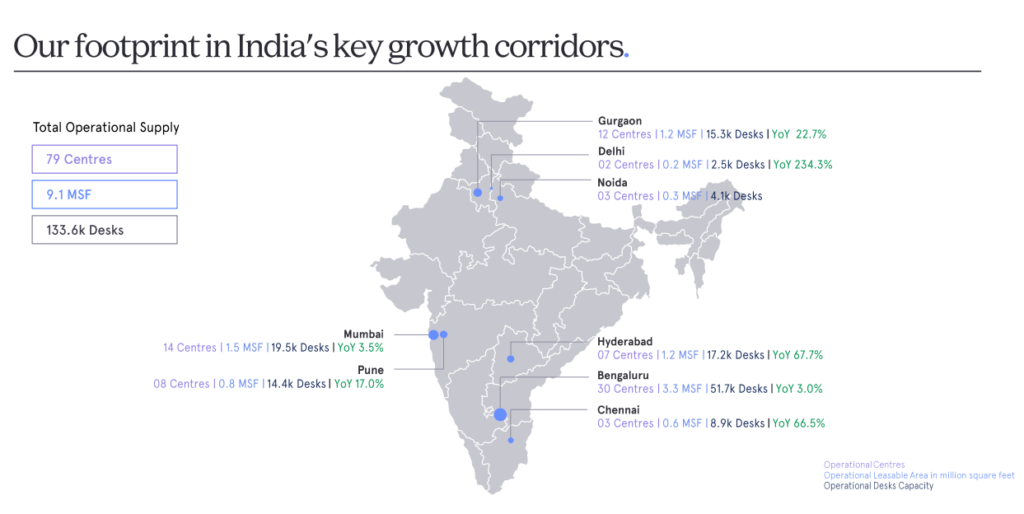
WeWork India Ltd has built a scaled platform with ~127k operational desks capacity across 79 locations in 8 cities with 96% of its capacity in Grade-A buildings.
WeWork India Ltd Sourcing
Embassy REIT has the largest portfolio 43.5 MSF in the peer set, ahead of KRT (37.3 MSF), Mindspace (36 MSF), BIRET (32.6 MSF) and Bagmane (16.6 MSF). It also carries the second-highest ROFO (Right of First Offer) pipeline at 12.6 MSF, behind only Bagmane’s 47.2 MSF, giving it one of the deepest future growth pipelines among listed office REITs.
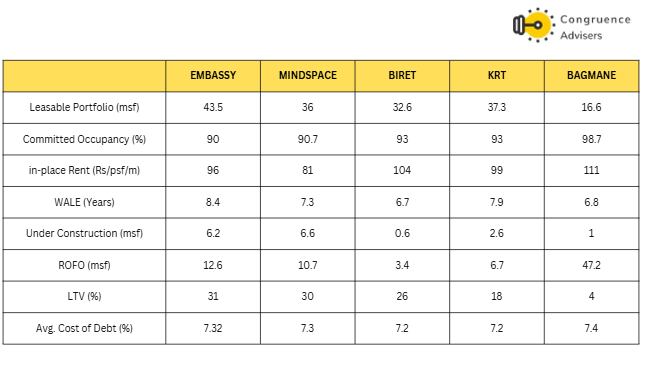
Since Embassy Group is both the REIT sponsor and WeWork India Ltd’s promoter, the scale of Embassy REIT’s existing portfolio and its large ROFO pipeline effectively give WeWork India Ltd first-look access to a wide, growing base of Grade-A supply. a sourcing advantage that a standalone flex operator simply doesn’t have.
WeWork Ltd Ltd Corporate Governance Analysis
Board composition – At March 31, 2026, the board had 6 directors: 1 executive (Karan Virwani, MD & CEO), 2 non-executive non-independent (Jitendra Virwani, Chairman, and Adnan Mostafa Ahmad, nominee of 1 Ariel Way Tenant Limited/WeWork Global), and 3 independent directors (50%), two of them women. There were no board changes during FY26. The audit committee is chaired by an independent director (Manoj Kumar Kohli) and though the MD, Karan Virwani, sits on it as a member.
Promoter remuneration – Karan Virwani’s salary, wages and bonus rose to ₹10.81Cr in FY26 vs ₹6.28 Cr in FY25, a 72% increase. Against IGAAP-equivalent PAT of ₹179 Cr, that’s about 6% of FY26 PAT.
Contingent liabilities – ₹62.2 cr at March 31, 2026 about 20.4% of net worth. Of this, ₹55.95 Cr relates to interest on disputed lease/rental litigation from the COVID period (where the company has denied liability and also faces SEBI complaints alleging non-disclosure of this litigation in the IPO prospectus, management maintains these are baseless), and the remainder is indirect tax disputes (GST/commercial tax matters across FY18-FY20, all under appeal, with management expressing confidence in its position).
Dividend – The board has not recommended any dividend for FY26
Audit and other points – No auditor qualifications were reported. Statutory auditor S.R. Batliboi & Associates LLP was re-appointed for a fresh 5-year term in July 2025. The secretarial auditor was newly appointed for FY26-FY30 (Umesh Parameshwar Maskeri). Internal audit was conducted by Deloitte Haskins & Sells.
Related party transactions – The RPT footprint here is really a mirror of the sourcing relationship rather than a red flag on its own. Lease liability payments to Embassy-affiliated landlords fell to ₹78 Cr in FY26 from ₹128 Cr in FY25, largely because Manyata Promoters exited related-party status in February 2025. Embassy Services, the group’s facilities arm, separately billed WeWork India ₹65.6 Cr for repairs and maintenance and ₹61.4 Cr for housekeeping in FY26, basically the facility management part.
Promoter Pledge – Embassy Buildcon has pledged 34.97% of its WeWork India shareholding (16.89% of total share capital). During Q1FY27, management stated that the promoter share pledge is expected to unwind through the year, either via asset sales at the parent level or a block deal.
A detailed corporate governance check would entail looking at these additional factors, if and when we get to writing a detailed initiation note on this business
- Intangibles involved in the business, do they form a big part of the balance sheet?
- Unit economics – do they fit into the normal range for a business of this nature?
- Is accounting complicated or simple? consistent or changes every few years?
- Consistency in disclosing FX losses/gains and MTM impact?
- Consistency in tax outgo in the cash flow statement and the P&L?
- Is the promoter family actively investing outside of the business- real estate, VC Funds?
- What other organizations are the promoters and directors associated with? Any history of defaults or frauds there?
- Any history of over the top speak by promoters/management in the media?
- Analysis of audit committee notes
- History of change/retention of statutory auditors & auditor remuneration trend
- Insights from credit rating reports
- Pending litigation against company & promoters?
It has been our endeavour over the years to enhance the scope and details of the corporate governance checks we conduct. However, the entire scope of this analysis would be an overkill at this stage of business analysis. This will be appropriate for a deep dive if and when a business is considered for inclusion in the portfolio.
WeWork Ltd Financial Performance
Operating Performance
The last few years were years of aggressive capacity build-out. Operational area increased from 6.3msf in FY24 to 7.4msf in FY25 and 8.6msf in FY26. Desk capacity too increased to 1.27 lakh while average utilisation improved to 87% and mature centres reached 88.9%, both record highs. Despite the larger operating base. with total revenue-to-rent at 2.94x. Commitment terms stood at 28 months (31 months for large enterprises).
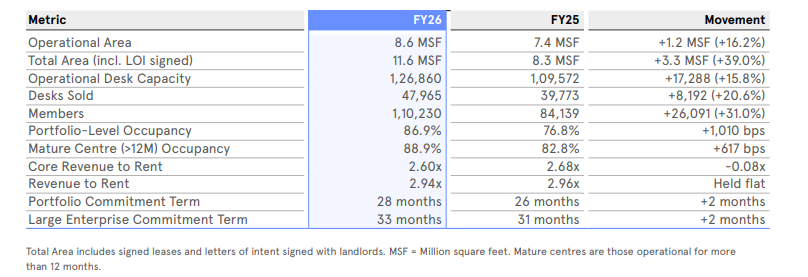
Q1FY27 carried the momentum forward, capacity reached 9.1 MSF across 135,800 desks, with the pipeline locked in at 10.3 MSF and 154,900 desks. Managed Offices drove over 40% of new capacity added, and signed member contract value rose 60% YoY to ₹3363 Cr, growing at double the pace of lease obligations.
Financial Performance
FY26 marked a real inflection in WeWork India’s financial profile, with operating improvement now showing up clearly in profitability and cash generation. On an IGAAP basis, revenue grew 23.4% to ₹2,477 Cr, EBITDA grew 23.1% to ₹499 Cr (margin steady at 20.2%), and PAT more than doubled to ₹179 Cr (margin up 341 bps to 7.2%). The improvement was broad-based led by higher utilisation, stronger realisations and operating leverage across a larger portfolio.
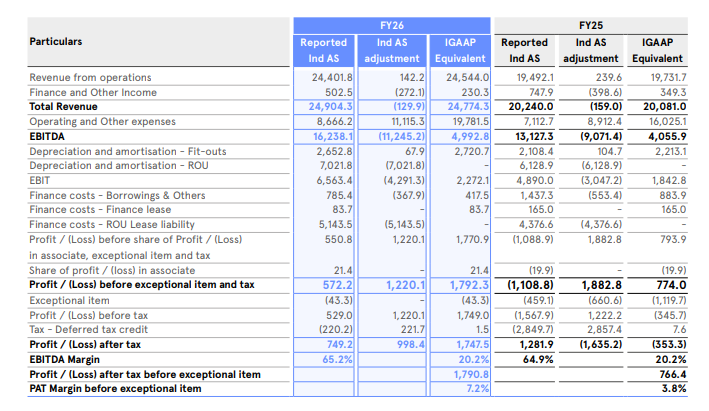
On the balance sheet front Gross borrowings fell to ₹400 Cr and the company turned net-debt negative, all achieved while continuing to expand the network and without any primary capital from the IPO (entirely an OFS).
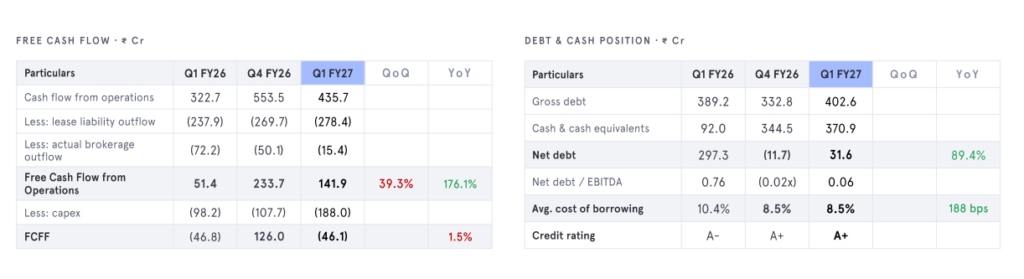
Free Cash Flow from Operations rose to ₹141.9 Cr, while capex nearly doubled to ₹188 Cr as the company front-loaded fit-outs for new centres and Managed Office expansions. Management flagged this as H1 are naturally capital intensive, “Growth costs come first and then returns follow” and advised evaluating the business YoY rather than sequentially. It also pointed to a structural cash timing benefit in the Managed Office model: upfront customisation payments from enterprise clients land as cash during the deployment quarter, funding capex internally, even though the corresponding revenue is recognised evenly over the contract term.
WeWork India Ltd Comparative Analysis
To understand WeWork India Ltd investment potential, we have conducted a comprehensive analysis. This analysis includes comparing WeWork India Ltd to its competitors (peer comparison) on various fundamental parameters and WeWork India share performance relative to relevant benchmark and sector indices.
WeWork India Ltd Peer Comparison
On the peer front Indiqube, Awfis and Smartworks are also listed ones along with two much smaller names, EFC Ltd and Kontor Space (SME). Put together, the listed universe is a minority of the country’s total flex stock.
The bigger part of the market sits in private. Table Space and The Executive Centre India are large enough on their own that a listing would meaningfully reset how the sector gets valued, and the wider private set, taken together, controls a larger portfolio. For anyone benchmarking WeWork India Ltd or its listed peers, this unlisted set matters as it’s the supply coming into the market, the pricing competition operators face today, and the forward comp set once these names list.
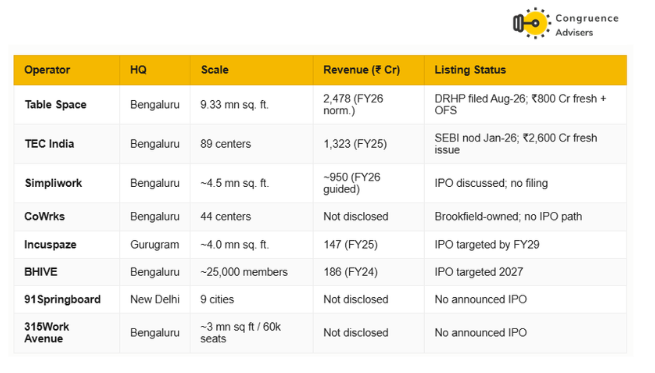
The IPO pipeline is already deep. TEC India has SEBI approval for a ₹2,600 Cr fresh issue, Table Space filed its DRHP in August 2026, and BHIVE and Incuspaze have guided to listings in 2027 and FY29 respectively. The private market is barbelled, not evenly spread: two enterprise-scale platforms already generate revenue above ₹1,300 Cr, while several other operators are still building toward the ₹300 Cr mark. Also, ownership structure is turning into a real differentiator. Simpliwork (backed by Sattva) and CoWrks (backed by Brookfield) are both developer or landlord affiliated, which gives them a structurally lower cost of space than a pure lessee, and more room to compete aggressively on price, something an operator like WeWork India Ltd.
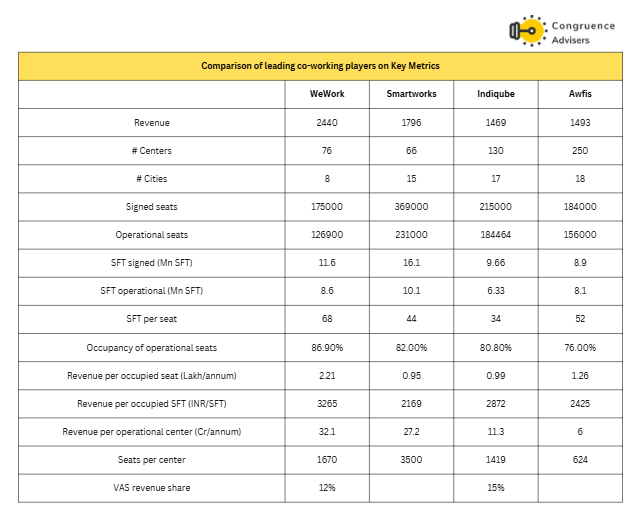
Among four listed operators, WeWork India, Smartworks, Indiqube and Awfis, have now built portfolios north of 9+ Mn sq ft signed, but they’ve reached that scale through different playbooks.
Smartworks leases bare shell buildings from non-institutional landlords (65% share) on
long term leases of 10-15 years with 6-12 months of rent-free period. Smartworks leases
large standalone buildings measuring 300-500k SFT each. 65% of the total supply is for
buildings with > 300k SFT area – so the focus is on large buildings.
Unlike Smartworks, Indiqube doesn’t only target Grade A properties in cities. They often go for Grade B properties which need some renovation capex. In lieu of the renovation capex,
They lock in cheaper lease rentals. About 26% of their seats are in renovated buildings.
Awfis is unique in the sense that 60%+ of its leased space is under the Managed Aggregation Model. In this model, Awfis does not pay a lease rent to the landlord but instead offers revenue share or profit share models of compensation to landlords. The
landlord incurs 50-90% of fit-out capex with Awfis incurring the rest.
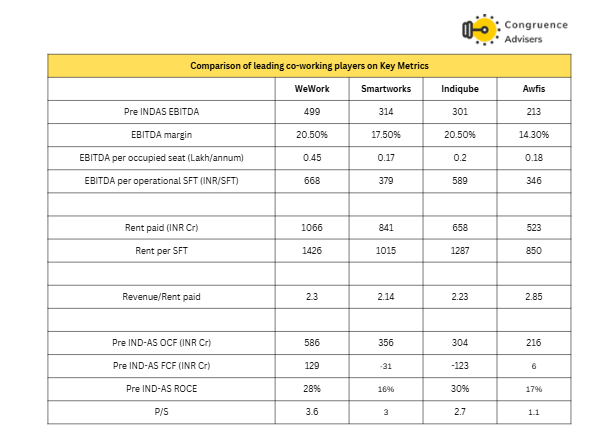
On product mix, WeWork India is the most diversified in terms of format and has branded centres, Managed Offices, digital products (On Demand, All Access, Virtual Office) and now Rivet.
Awfis trades at the lowest P/S (1.1x) of the four listed peers. On the other hand WeWork India, commands the highest P/S (3.6x) in the set backed by the best revenue-per-occupied-seat (₹2.21 lakh/annum, nearly double that of Indiqube and Awfis) and the best pre-Ind AS ROCE (28% vs 16-30% for peers). Wework India ltd’s ability to command premium pricing is a function of brand recognition, enterprise mix and pricing power all showing up directly in the multiple the market is willing to pay.
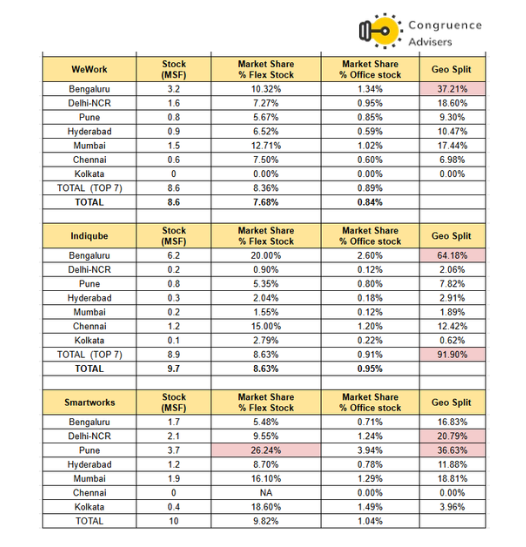
In terms of flex market share, all three operators are strongest in their core cities but remain under 1% of total office stock even in their best markets, underlining how early-stage flex penetration still is against the broader Grade-A office base.
Why You Should Consider Investing in WeWork India Ltd ?
WeWork India Ltd offers some interesting reasons to track closely and to consider investing if one is looking to bet on India office & GCC growth story.
Global Brand Equity with Domestic Developer Promoter – WeWork India Ltd is uniquely placed as they hold an exclusive, long-term license to use the WeWork brand across the country. WeWork Inc has a presence across 35 countries and 600 locations. That gives WeWork India a real edge with MNCs and GCCs, who are often already standardised around the WeWork format from other markets, making WeWork India the default choice on entry.
On ownership, it is Majority owned and promoted by the Embassy Group (a top Indian developer and sponsor of Embassy Office Parks REIT), WeWork India Ltd secures early access to prime tech park developments on preferred terms.
A purely domestic peer doesn’t carry the multinational brand recognition and a foreign peer entering India without a local partner would have to build supply access.
A Direct Proxy to India’s GCC Growth Story – Structural growth in India’s office market is creating a significant runway for WeWork India Ltd. The single most important demand driver is the rise of GCCs as anchor tenants for flexible workspaces. Industry-wide, GCCs now account for 35-40% of new flex-space seat leasing, and with India adding centres at scale and existing GCCs continuing to expand their footprint. GCC flex leasing is projected to grow at a 28% CAGR, while overall flexible workspace stock is expected to expand at an 18% CAGR through CY30. We believe owning WeWork India Ltd is close to taking a bet on GCC expansion in India.
Shorter Planning Horizons Are Rewriting Corporate Real Estate – The way large enterprises plan real estate has fundamentally changed. As planning cycles have collapsed: long-term leases (5+ years) dropped from 40% of enterprise demand to just 8%, while 1 to 3-year horizons now represent 60% of enterprise setups. In effect, corporates are now treating office space the way they treat any other outsourced function, plug in, scale up or down as needed, and hand over the operational headache, rather than owning and managing it themselves and this is turning out to be a tailwind for flex operators.
Managed Offices Adds a More Predictable Revenue Layer – WeWork India ltd is shifting from a startup-heavy customer mix towards GCCs, large technology companies and professional services firms Which will improve the quality and durability of revenues. As larger enterprise deployments typically involve higher seat commitments, longer-duration requirements and greater potential for expansion, while existing customer growth entails lower acquisition intensity than new customer additions. Together, rising enterprise penetration and expansion-led demand should support more stable occupancy, better revenue visibility and a less cyclical growth profile for WeWork India Ltd
Strong Balance Sheet, High Cash Generation and Operating Leverage – Wework India Ltd is now funding capex for new centre additions through internal cash generation, with pre IND AS Cash Flow from Operations reaching ₹586 Cr in FY26, and WeWork India Ltd operates with a net debt-negative balance sheet. Another key driver of WeWork India Ltd growth story is the increasing maturity of its existing center portfolio, which should support operating leverage beyond incremental capacity additions.
Superior Pricing Power & Revenue Predictability – WeWork India Ltd commands superior pricing power, as shown in the peer comparison earlier. It charges premium psf/seat pricing vs peer which is driving a total revenue to rent multiple of 2.9x (core multiple of 2.6x), well above the industry benchmark range of 1.9-2.5x. This pricing power is backed by a sticky, high-quality occupier base, corporates make up 77% of core revenue, with GCCs alone contributing 36.7% in FY26. Long commitment terms, averaging 28-33 months, add revenue visibility on top of that with ₹1885 Cr of revenue already locked in entering FY27.
What are the Risks of Investing in WeWork India Ltd?
Investors need to keep the following risks in mind if they choose to invest into this business. Risks needs to be weighed in combination with the advantages listed above to arrive at a decision that is optimal for your portfolio construct
GCC and Global Tech Cycle Sensitivity – Flex demand is closely linked to global companies expanding operations in India, and a slowdown in GCC capex or hiring could hit demand fairly quickly. New GCC announcements and expansion pace are the early indicators worth tracking here. More broadly Global tech slowdown, recession, or bout of geopolitical uncertainty could lead to early contract terminations or slower seat additions.
Occupancy Risk and Asset-Liability Mismatch – Management itself identifies occupancy volatility as the single biggest risk to the business. Because centres carry largely fixed real estate overheads, any sudden or sustained drop in member occupancy hits unit economics and cash flow directly
On the liability side, WeWork India Ltd signs long-term leases with landlords, typically 3 to 10 years, with fixed rental payouts and lock-in periods. On the other hand, member agreements are far shorter, generally 12 to 36 months. In a downturn, this mismatch works against the company as WeWork India Ltd remains on the hook for fixed lease rentals and CAM charges to landlords even if member demand softens or rental realisations fall.
Micro Market Supply Glut, Developer Disintermediation and Competitive Intensity – Too much new supply in certain micro-markets, particularly peripheral areas could pressure occupancy and pricing. Hyderabad’s current elevated vacancy is a live example of this dynamic already playing out. The key indicator to track is new supply relative to occupancy growth in these specific micro pockets, not just city-level averages.
Part of that supply pressure comes from within the industry itself. The flex workspace business is fundamentally easy to enter with no real structural barriers, and anyone with capital and a landlord relationship can set up a competing centre. The market structure already reflects this alongside listed peers like Indiqube, Awfis and Smartworks, there’s a deep bench of unlisted players Table Space, TEC India, etc operates at similar scale.
Large developers are also increasingly launching their own flexible-office platforms rather than leasing to third-party operators, as Sattva has done with Simpliwork and Brookfield with CoWrks. This could limit other players’ access to premium assets, or force it to accept higher revenue shares to landlords to secure the best buildings, either of which pressures margins. Brand and promoter backing help at the margin & sourcing. but it doesn’t stop a well-capitalised competitor from undercutting on price in any given micro-market.
Brand Licensing (Dependency on WeWork Global) – WeWork India Ltd operates as an exclusive licensee under an Operations and Management Agreement with WeWork International Limited. If it fails to meet the terms of that agreement, or if the license is terminated for any reason, WeWork India would lose the right to use the WeWork Brand the very assets our note has highlighted as a core moat. That risk is tempered by the length of the agreement, a 99-year exclusive term, which makes near-term termination unlikely, but it doesn’t remove the dependency altogether.
There’s also reputational spillover risk that’s largely outside WeWork India’s control. Negative publicity or corporate events involving WeWork Inc globally, such as the 2023 Chapter 11 restructuring, can create confusion among investors, landlords and members in India, even though the businesses are financially and operationally independent. The 2016 deal structure protects WeWork India’s balance sheet from WeWork Global’s troubles, but it can’t fully insulate the brand’s perception in the market.
Governance and Promoter-Related Risks – Promoter pledges, brand licensing, related-party transactions and low book equity after Ind AS 116 are few more risks. Specific flags include a pending PMLA proceeding against promoter and chairman Jitendra Virwani since 2014, SEBI show-cause notices against group entity Embassy Office Parks Management Services, a portion of promoter shares pledged against borrowings, and a web of related-party transactions where promoters hold interests in key lessors. None of these are disqualifying on their own, but together they’re worth tracking closely given the promoter-led structure.
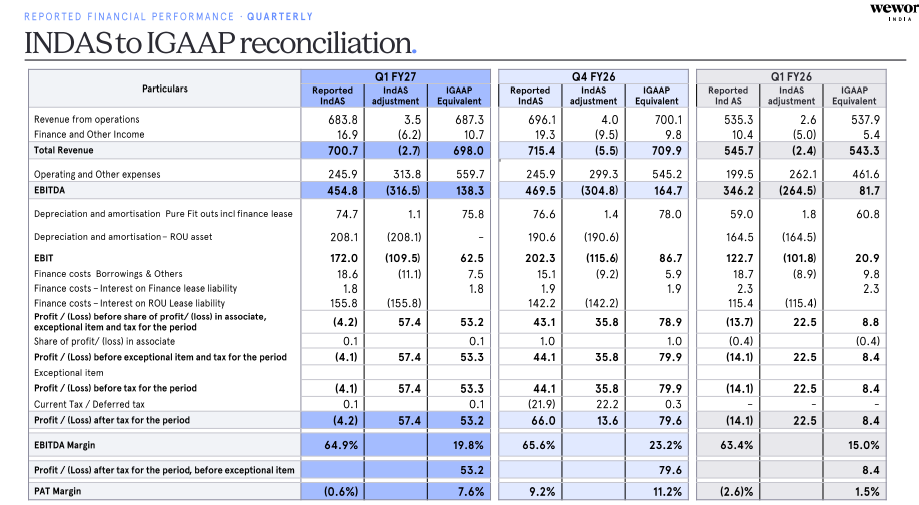
Accounting-Driven Mispricing (Under Ind AS 116) – Ind AS 116 can distort how profitability looks on paper. It tends to make EBITDA margins appear unusually high for a lease-heavy operator while pulling reported PAT numbers below underlying cash profitability, especially during a phase of rapid expansion. Investors relying only on headline reported numbers could misread the business.
WeWork India Ltd Future Outlook
Management has reaffirmed guidance of 20%+ revenue and EBITDA growth for FY27, with capex of ₹500-600 Cr funded entirely from internal cash generation. The company is in a growth-capex phase: it opened the year with 9.1 MSF and 133,600 desks, and expects to end FY27 at 10.3 MSF and 155,000 desks, with 43,600 desks already locked in via signed leases and LOIs, a 32% capacity addition. Around 19,000 of the planned 28,000 new desks this year will be WeWork-branded with the rest coming from pre-committed managed office deals that open at full occupancy from day one.
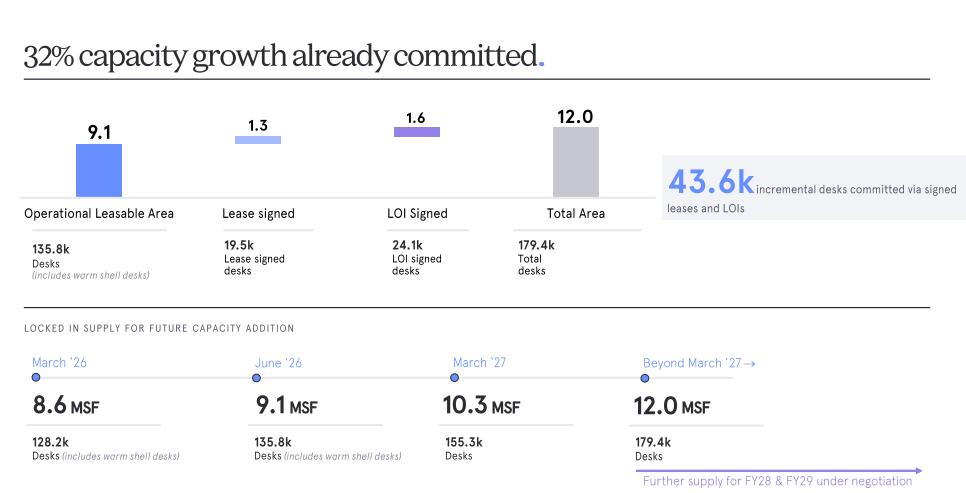
Management has flagged that Q1 looked softer purely because fixed costs land before revenue, standard for a growth cycle, and expects margin to improve through the year rather than dip the way it did last year, helped by a stronger managed-office mix and a smoother, amortised treatment of customisation revenue going forward. Expansion is concentrated in markets with the strongest GCC and enterprise demand i.e Bengaluru, Hyderabad and Chennai lead, alongside premium additions in NCR Aerocity. The order book already backs this up, with locked-in core revenue entering FY27 at ₹1,885 Cr (consolidated) rising further to ₹3,363 crore in signed future commitments by Q1FY27, up 60% YoY.
WeWork India Ltd Technical Analysis
We consider technical analysis to be a useful input in taking medium-term investment decisions. Many a time price action tends to lead to fundamental developments; this is too important an aspect to be ignored by retail investors who do not have access to management outside of common forums like investor calls & AGM.
At Congruence Advisers we like to consider both the long-term weekly chart and the daily chart to arrive at a view on price action. Combined with our understanding of fundamentals, we usually end up being better placed to be able to judge both the business cycle and the stock cycle. Playing the stock cycle right is extremely important for investors looking to extract significant alpha over the medium term.
WeWork India Ltd Price charts
Since Wework India Ltd listed only in October 2025 and has a limited trading history, we will limit our technical analysis to the day chart alone.
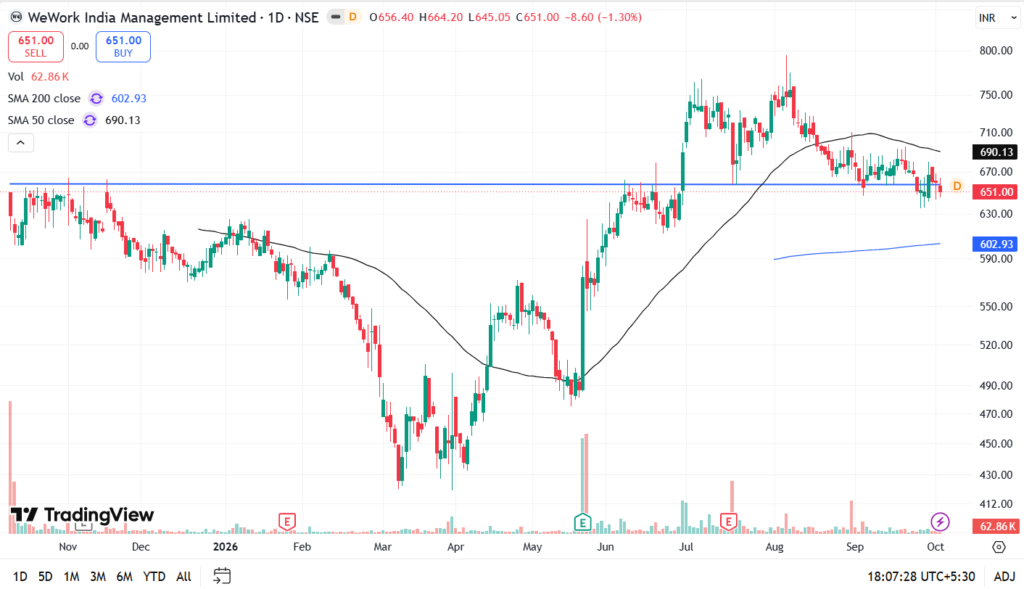
The day chart doesn’t provide any great insights into how the price trend is placed right now. All one can observe is that the CMP is hovering around the IPO level after making an attempt to break into a new all time high in the small cap bull run of Q1 FY27.
For such a business which has a limited trading record and operates in a new sector, it would not be prudent to give too much weightage to the technical trend. The business has traded below the 50DMA for the most part in 2026. Clearly the sector and the business don’t fall into the category of “market favourites” yet in this narrow small cap bull run of FY27.
WeWork India Ltd Latest Latest Result, News and Updates
WeWork India Ltd Quarterly Results
Revenue grew 28.5% YoY to ₹698 Cr with core operations still the main driver (+29.8% to ₹603.6 crore). FCFO surged 176.1% to ₹141.9 Cr even as capex nearly doubled to ₹188 Cr, leaving FCFF at -₹46.1 Cr as H1 is more capex heavy. Net debt fell ~90%, and occupancy hit 84.9% (mature centres at 87.5%). Management pointed to YoY as the right lens given front-loaded capex, and flagged the 7,000 newly opened desks in this quarter as the next leg of margin expansion as they mature through H2.
Final Thoughts on WeWork India Ltd
WeWork India Ltd is an interesting combination of global brand power and a domestic promoter. The WeWork licence gives it instant credibility with MNCs and GCCs already standardised on the format elsewhere, while Embassy Group gives it sourcing access to Grade-A office space that a standalone operator would take years to build on its own.
The underlying business, though, has no real tangible moat yet. Leasing space and subletting it is replicable by anyone with capital and a landlord relationship, and the market reflects that: four listed operators running four different playbooks, plus a bunch of private names heading toward their IPO. What WeWork India Ltd has built is a known brand to some extent and commands a bit higher pricing power relative to the flex universe within that open field, not a structural barrier competitors can’t eventually cross. This shows up in the oligopolistic market structure where the top four players are comparable in scale, if not similar.
The flex industry itself is still early. Flex stock has tripled since 2020 to ~110-114 msf, yet penetration is only 10-12% of Grade-A office stock, with stock across the top 7 cities projected to grow further from ~103 msf to ~236 msf by CY30, an 18% CAGR. At the same time, there are early signs of consolidation: the top 10 operators already account for more than 55% of flex stock, even though the market remains fragmented beyond that. That consolidation is likely to keep favouring scaled and well capitalised names over smaller, fragmented operators who increasingly compete on price alone in a narrower pool of demand.
The real driver underneath all of this is GCC adoption and the broader restructuring of how Indian and multinational corporations plan real estate. Hence, betting on flex operators is effectively a proxy to play the rise of GCCs and a continuing shift toward Grade-A, flex-ready space. The stock already prices a lot of this and it’s the most expensive name in its own peer set, so the market has already given it credit for the brand premium and the Embassy relationship. The next 18-24 months will likely decide whether this premium holds or compresses. If occupancy keeps climbing through the current capex cycle, if the GCC-led demand story keeps broadening and if management delivers on its 20%+ growth guidance without diluting margins.
Putting the pieces together, WeWork India Ltd looks like a well run flex operator operating inside a replicable industry, and the valuation already reflects that nuance. The company till now is being rewarded for executing better than peers inside a business anyone can technically enter; WeWork India Ltd continues to deliver higher occupancy, a richer enterprise and GCC mix, longer commitment terms, and a balance sheet that funds its own growth.
It’s also worth placing WeWork India Ltd within the broader set of ways to play India’s real estate growth story. Other stories in adjacent categories include hotels (Samhi, Lemon Tree, covered separately in our microcap universe), student housing (Elevate Campus, recently listed), and co-living/rental platforms (Aurum). Comparing coworking operators to listed REIT’s that are playing the same theme is also a good idea.
Given the limited listed track record of the coworking sector in India, the underlying theme it is playing and the numbers of comparable alternatives in the listed space, we would file this under the category of “worth tracking and understanding better” over the next few quarters. Unit economics are particularly attractive and will likely stay good unless a tail event of demand compression hits the sector out of the blue.
We suspect that the real differentiator for coworking spaces is the ability to fill contracted space as early as possible, which calls for a very strong business development and marketing engine. This is an intangible that can be evaluated only through a series of qualitative channel checks and on the ground work. From what we know, a good chunk of the business is still being routed through the real estate deal advisory firms (Knight Frank, CBRE, Cushman & Wakefiled, JLL and the like); hence there is a large channel sales component to evaluate as well.
We also think that the market is willing to pay a premium to Wework India Ltd over the nearest larger peer Smartworks because of the proven ability of Wework India Ltd to monetize space to the startup & small business segments (higher margin at similar utilization when compared to the enterprise managed workspaces model) which confers some degree of resilience and pricing power to Wework India Ltd. Wework India Ltd was trading at a ~40% valuation multiple premium to Smartworks Coworking Spaces Ltd for this optionality, Smartworks is known to have a lag between adding inventory and tenanting it out fully to large enterprises, which is to be expected; large enterprises will need to see the inventory in place before they agree to take a space on long term lease.
Of course Wework India Ltd’s superior brand and customer experience (we know this since we have operated out of a Wework office in the past) deserves a premium, does it justify a 40% premium?
That’s the answer we will look to get a good handle on as we spend more time tracking this business over the next few quarters.
Disclaimer – This note is part of a business research & analysis series on small companies, there is no BUY/SELL recommendation or target price issued as part of this to a general audience. There is no assurance that this stock makes for a good investment, there is no guarantee that this stock will continue/be included in the coverage universe of Congruence Advisers. The note contains some forward-looking statements and insights drawn from the historical results, annual reports and investor presentations; they are to be viewed only within this context and not as a prediction of future performance of the business or the stock covered.
While due care has been taken to ensure that the information here is as accurate as possible, Congruence Advisers disclaims any liability in case of any unintentional inaccuracies.
The content does not constitute investment advice.